

Abstract
Tropical forests are global climate regulators through their interaction with hydrological and biogeochemical cycles. Despite extensive research on deforestation in South America and its global impact, the role of the largely intact Guiana Shield forests, north of the Amazon, has not yet been considered as part of this climate system. We use a regional climate model with a realistic deforestation scenario to test the impact of deforestation in the Guiana Shield on climate throughout South America. We show that replacing ~28% of the current Guiana Shield rainforest with savannah leads to multi-scale impacts across South America, through vegetation-land-atmosphere interactions that disrupt the initial phase of two major 'atmospheric rivers': the Caribbean low-level Jet and the South American low-level jet (SALLJ). Our climate simulations suggest that following deforestation, locally, precipitation and runoff would more than double in lowland forests, whilst mean annual temperatures would increase by up to 2.2 °C in savannahs. Regionally, significant wetting is simulated in northern South America (April−September) and the western Amazon (October–March), while temperatures increase up to 2 °C in central and eastern Amazon, causing more dry months in up to 64% of the Amazon basin. Reduction of moisture transfer by the SALLJ of 2.2% of total annual flow causes noticeable and highly diverse spatial changes in simulated monthly rainfall in la plata basin (LPB). These results highlight the potential consequences of land cover change in a sensitive hot-spot with hydro-climatic impacts 1000 km west and 4000 km south. Such multi-scale perturbations can severely impact biodiversity and ecosystem services across South America, including agriculture in LPB. Recognition of the far field effects of localised deforestation in key areas is urgently needed to improve development plans for a sustainable future.
Significance statement
The Guiana Shield, at the northern boundary of Amazonia, is located at the start of two atmospheric rivers which carry moisture across South America. We show that deforesting less than a third of the Guiana Shield, in areas currently under threat from mining, logging and agricultural activities, could result in significant changes in the water cycle across the continent. This includes large variations in temperature and precipitation affecting areas 4000 km away, impacting ecosystems and economies, with consequences for society. The study demonstrates how land-use change, even if small in spatial scale, but occurring in particularly sensitive hot-spots, can alter the flow of atmospheric rivers, with large consequences. This pan-continental cascade must be considered when designing trans-national management plans for a sustainable future.
Export citation and abstract BibTeX RIS

Original content from this work may be used under the terms of the Creative Commons Attribution 3.0 licence.
Any further distribution of this work must maintain attribution to the author(s) and the title of the work, journal citation and DOI.
Introduction
Understanding the role of water in the Earth system, especially within the humid tropics, is one of the major scientific challenges today. The humid tropics cover approximately 40% of the Earth's surface, and hydrological processes here have much greater energy inputs and faster rates of change than in any other climate zone (Wohl et al 2012).The tropics critically regulate many Earth system processes by exerting a huge and rapid influence on the water cycle, planetary energetics and global atmospheric composition (Bonan et al 2008), thereby impacting climate and hydrological response regionally and globally (Lawrence and Vandecar 2015, Devaraju et al 2015). Given their global significance and sensitivity to climate change, tropical forests have been identified as a key biome for comprehensive study (Chambers et al 2012).
In South America, international research on the regional and global impacts of deforestation have largely focussed on the Amazon River basin (Malhi et al 2008, Lorenz and Pitman 2014, Spracklen and Garcia-Carreras 2015, Lawrence and Vandecar 2015, Devaraju et al 2015), its 'arc of deforestation' (Silva et al 2015) or areas further south (Salazar et al 2015), with the Guiana Shield to the north not explicitly considered for its role as part of the climatic system. The Guiana Shield covers parts of northern Brazil, southern Venezuela, eastern Colombia and all of the Guianas (Guyana, Suriname and French Guiana) and incorporates ~1 342 000 km2 of continuous, intact tropical forest (Hammond 2005), approximately 26% of Amazonia (based on RAISG 2012). As large-scale deforestation continues in the southern Amazon basin (e.g. RAISG 2012), the Guiana Shield forests may increasingly represent a greater share of the remaining closed forest cover of Amazonia (Hammond 2005).
The Guiana Shield is strategically positioned to the northeast of South America (supplementary figure 1 available at stacks.iop.org/ERL/13/074029/mmedia), at the point where the easterly trade winds begin to bring vast amounts of moisture from the equatorial Atlantic Ocean into the centre of the continent, thereby directly influencing precipitation in the Amazon basin and areas as far south as La Plata Basin (LPB). Moisture is transferred across the continent largely through two major 'atmospheric rivers': the Caribbean low-level jet (CLLJ) (Poveda et al 2006, 2014) to the north (figure 1(a)), and the atmospheric river taking moisture-rich air from the equatorial Atlantic Ocean, over the Guiana Shield into Amazonia and then south to LPB via the South American low-level jet (SALLJ) (Marengo et al 2004, 2012) (figure 1(b)). This moisture contributes to continental precipitation which is sustained by evapotranspiration from rainforests via moisture recycling (van der Ent et al 2010). Densely vegetated areas such as rainforests (as opposed to savannahs) contribute substantially to rainfall generation downwind (Spracklen et al 2012) emphasising the role of wind patterns in redistributing moisture across the land surface.
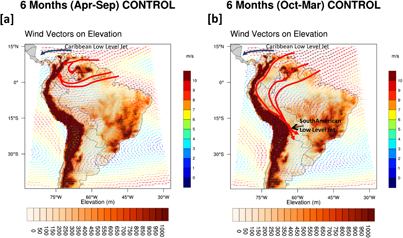
Figure 1. Elevation map of South America (m) superimposed by 30 year (December 1980 to November 2010) mean seasonal 925 hPa wind fields (m s−1) for (a) October–March and (b) April−September for the control simulation derived from the PRECIS RCM, and highlighting the CLLJ and the SALLJ, as well as the main wind flow pathways over the Guiana Shield.
Download figure:
Standard image High-resolution imageMajor wind patterns in South America are controlled by seasonal shifts in the inter-tropical convergence zone (ITCZ). In the austral winter (April−September), the ITCZ is north, and the trade winds advance west over the northern tip of South America, feeding into the CLLJ (Poveda et al 2006, 2014). Over the continent, these winds carry moisture into eastern Colombia and back around the Guiana Shield highlands, supporting high rainfall in the Venezuelan Amazonas (figure 1(a), supplementary figure 1). Conversely, in the austral summer (October–March), the ITCZ is south, and the trade winds carry moist air over the Guiana Shield and into Amazonia before being diverted southeast by the Andes. Near Bolivia, this atmospheric river narrows into the SALLJ (Marengo et al 2004, 2012), before moisture is distributed over the LPB where meso-scale convective activity leads to rainfall generation (Salio et al 2007), essential for sustaining agricultural activities (Marengo et al 2004, 2012) in one of the largest food producing areas of the world (Salio et al 2007) and for generating ~70% of the GDP of the LPB area (Mechoso et al 2001) (figure 1(b)). In fact, LPB has been shown to rely on moisture from Amazonia for 70% of its water resources (van der Ent et al 2010) with the initial source region originating in the Guiana Shield (Duran-Quesada et al 2012). Although the Guiana Shield has been recognised as a potential moisture source (van der Ent et al 2010), its role in regulating this moisture flow across the continent has not yet been considered.
It has been shown that in the tropics, forests have high rates of evapotranspiration and the surface warming arising from their low albedo is offset by strong evaporative cooling, thereby resulting in an overall cooling of the surface air temperature (Bonan et al 2008). High levels of water vapour can support the formation of clouds which contribute to additional cooling by reflecting away sunlight, whilst the forests' uneven canopy (and thus high surface roughness), can also help increase upwelling of air thereby maintaining high precipitation levels (Jackson et al 2008) through moisture recycling. It is therefore conceivable that deforestation in the Guiana Shield, positioned at the start of two atmospheric rivers, could cause disproportionately large impacts downwind by lowering evapotranspiration, increasing surface air temperature, decreasing precipitation, and hence lowering the recycling ratio, eventually leading to drying in the La Plata Basin. Recent modelling studies also conclude that the impacts of deforestation are strongly dependent on the geographical location of the deforestation (Devaraju et al 2015, Jackson et al 2008), with both the orientation and size of deforested patches influencing regional climate (Lawrence and Vandecar 2015). Furthermore, impacts would compound those resulting from deforestation in the southern Amazon (Lawrence and Vandecar 2015, Silva et al 2015, Salazar et al 2015): for example, deforestation-induced disturbances to the continental-scale moisture pathways could be strong enough to influence the zonal variability of the ITCZ (Wang and Fu 2007, Badger and Dirmeyer 2015, Devaraju et al 2015) and thus precipitation patterns in North America (Avissar and Werth 2005, Medvigy et al 2013), Africa (Mounier et al 2007, Nguyen and Duvel 2008, McKonnen et al 2008) and western Europe (Gedney and Valdes 2000) via large-scale tele-connections (Lawrence and Vandecar 2015).
Here we test whether a realistic scenario of deforestation in the Guiana Shield can result in local, regional and continental scale climatic impacts in South America. We used the PRECIS (Jones et al 2004) regional climate model (RCM) driven by ERA-Interim reanalysis (Dee et al 2011) run at 0.44° (~50 km) resolution over South America (see Methods section for further details). We ran a control simulation from December 1979 to November 2010, disregarding the first year as the spin-up period. We also ran a deforestation scenario for the same 30 year historical period to assess the resultant climate impacts. The deforestation was simulated in the model by changing key biogeophysical properties of vegetation in the model, including surface albedo, roughness and hydraulic properties of the roots and vegetated canopy, important for regional impacts (Devaraju et al 2015, Jackson et al 2008). For the scenario we increased the proportion of savannah in the Guiana Shield at the expense of rainforest from the current 14%–42% based on existing or proposed mining concession locations (RAISG 2012) (figure 2(a), supplementary figure 2). We then compared the land-cover scenario against the control (no change) to understand the local, regional and continental scale impacts of deforestation.
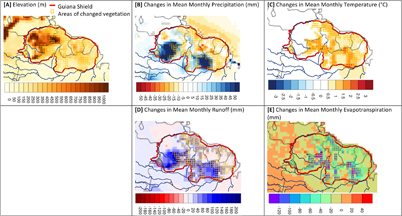
Figure 2. (a) Elevation of the Guiana Shield showing grid-cells where primary and/or secondary vegetation was changed to savannah (see also supplementary figure 2). (b) Changes (deforestation scenario minus control) in mean monthly precipitation (mm) for December 1980 to November 2010. (c)–(e) and as for (b) but for temperature (°C), runoff (mm) and evapotranspiration (mm) respectively.
Download figure:
Standard image High-resolution imageResults and discussion
Local scale impact
Our model simulations show that locally, following deforestation, average monthly rainfall increases in lowland, downwind forests in the Guiana Shield, particularly over the Venezuelan Amazonas and the Brazilian Trombetas Catchment (+717 mm year−1 (23%) and +374 mm year−1 (19%), respectively) (figure 2, supplementary figures 1, 20). This is accompanied by large increases in runoff (+800 mm year−1 (49%) and +668 mm year−1 (103%), respectively). Additional increases in rainfall and runoff occur over the Rio Negro, connecting both areas. Monthly scale impacts are much more pronounced, with significant wetting occurring in the Venezuelan Amazonas and surrounding area between April−November. Strikingly, the Trombetas catchment, despite experiencing overall wetting at the annual scale (with significant wetting occurring between March–July), becomes drier during September–October (although not with a significant change), showing an intensification of the rainfall cycle (supplementary figures 5, 6, 20). Significant increases in downwind rainfall are particularly pronounced across savannah to forest transitions where there is a relatively sharp decrease in moisture transport due to a reduction in low-level wind velocities caused by the relative increase in surface roughness. Conversely, (insignificant) drying occurs along the Guiana coastlines upwind of the deforested areas, related to decreases in surface roughness and turbulence causing increases in wind-speeds, consistent with previous modelling (Saad et al 2010, Nogherotto et al 2013) (see supplementary figure 3). Over newly deforested areas, annual average temperatures increase (up to 2.2 °C) (figure 2) due to a rise in monthly mean maximum temperatures (supplementary figure 20), whilst evapotranspiration decreases (up to 142 mm month−1) (figure 2, supplementary figures 3, 20). Changes in mean monthly temperatures, evapotranspiration and runoff are significant across most of the Guiana Shield (supplementary figures 11, 15, 19). Deforestation generally has competing effects on surface air temperature: reductions in evapotranspiration and surface roughness (hence turbulent exchange) can lead to increases in temperature, whilst increases in surface albedo can reduce net solar radiation amount thereby decreasing temperatures (see Zhang et al 2013). The resultant temperature change is dependent on the balances of these processes (Jackson et al 2008) along with the effect of any changes in atmospheric humidity and cloudiness on long-wave radiation forcing. In the tropics, most large-scale deforestation simulations tend to result in increased temperatures (see Zhang et al 2013) consistent with this work.
Regional scale impact
Deforestation in the Guiana Shield also results in large regional impacts in our simulations. During April−September, when the ITCZ is north and trade winds contribute to the CLLJ, most impacts are restricted to areas north of the equator. Significant wetting extends west from the Guiana Shield into western Colombia in April−September (figure 3, supplementary figures 4–7, 20), resulting from enhancement of the moisture convergence in this region downwind of the Guiana Shield (figure 1(a), supplementary figure 23). Towards the end of this period, as the ITCZ begins to move south (Jul-Sep), significant drying occurs south of the Guiana Shield in the central to western Amazon due to reduced moisture convergence (supplementary figure 23). Consequently significant monthly mean temperatures increase up to 2 °C (supplementary figures 8–11, 20) and evapotranspiration decreases up to 40 mm month−1 (supplementary figures 12–15, 20). This area also experiences increased numbers of dry months (<100 mm month−1 (Sombroek 2001)), particularly in July when up to 64% of the Amazon basin is impacted to some degree. A maximum of ten July months out of the 30 years simulated become dry, indicating an extension of the dry season (figure 3, supplementary figures 21–22).
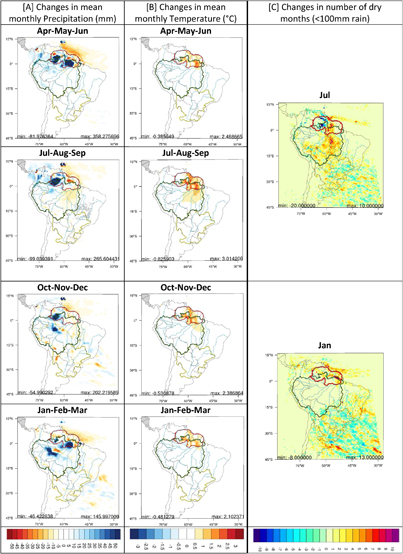
Figure 3. Changes in mean monthly precipitation (a) and temperature (b) showing Guiana Shield (red outline), Amazon Basin (green outline) and LPB (yellow outline). (c) Changes in the number of dry months where a dry month is assumed to have <100 mm month−1 rainfall (Sombroek 2001).
Download figure:
Standard image High-resolution imageFrom October to March, when the ITCZ is south, regional impacts occur south of the equator with wetting (>218 mm year−1, 7%) and increased runoff (>217 mm year−1, 14%) in the core (western Brazil) region of the Amazon basin, particularly in January (figure 3, supplementary figures 4–7, 16–20). This region has been referred to as an aerial lake (Arraut et al 2012). Weak atmospheric flow tends to allow for further accumulation of moisture (leading to increased wetting) in the area, but when the flow strengthens again, an above-normal release of moisture from the basin occurs via the SALLJ area to LPB (Martinez and Dominguez 2014). In our simulations, following deforestation in the Guiana Shield, meridional moisture transfer through the SALLJ is reduced by 0.35 GT day−1 (equivalent to 2.5%) at 18°S (with control flows of −14.10 GT day−1 between −64°W to −54°W) (figure 4) resulting in complex patchy wetting and drying patterns in the LPB region (supplementary figure 5, November–March).
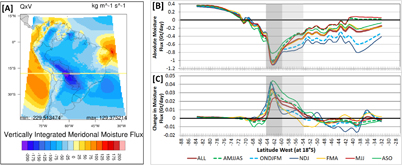
Figure 4. (a) Vertically integrated meridional (north-south) moisture flux (specific humidity (Q) x meridional wind (V) component). By convention negative numbers refer to magnitude in the southerly direction. Magnitude of moisture flux (b) and changes (c) along the latitudinal line at 18 °S shown in showing that the moisture flux is less intense and spans a broader area during the dry season (ASO) with reductions of moisture flux of 4.7% (−64 to 54°W, grey area). Conversely, flow is particularly intense over a narrower corridor between −64 to −60°W (dark grey area) in NDJ (Marengo et al 2004, Poveda et al 2014), with reductions of over 2.8% (with a maximum reduction of 6.9% at −64 W).
Download figure:
Standard image High-resolution image
Figure 5. (a) Percent change in precipitation between deforestation scenario and control simulations averaged over SESA and SACZ dipole areas for December 1980 to November 2010. Increases or decreases in precipitation of over 25% have been highlighted with the appropriate date. 5% of monthly rainfall in SACZ has reductions of 21% or more, whilst 5% has increases of 31% of more; 5% of SESA rainfall has reductions of 20% or more whilst 5% has increases of 21% or more. (b) Map showing SESA and SACZ zones. (c) Mean monthly (control) precipitation for SACZ and SESA (solid line is control, dotted line is scenario). Note that most changes over 25% occur between October–March for both areas (corresponding with SACZ wet season), and mostly occur every year, with several months experiencing precipitation change of >40%, constituting particular months where drought or flooding could significantly impact agricultural activities.
Download figure:
Standard image High-resolution image
There is naturally a large variability in the direction of flow from the SALLJ to subtropical areas, where moisture is dispersed in a wide 'atmospheric delta' covering large parts of southern South America: southward anomalies of flow are associated with increased rainfall in south-eastern South America (SESA) in LPB, whilst eastern anomalies (linked with an eastward shifted SALLJ) contribute to increased rainfall in the South American Convergence Zone (SACZ) slightly north of LPB (Silva and Berbery 2006, Boers et al 2015) (figure 5). A rainfall dipole behaviour between these two areas has previously been linked with the South American Monsoon System (Nogues-Paegle and Mo 1997, Boers et al 2014). Our simulations show that the patchy wetting and drying over LPB following Guiana Shield deforestation is not significant at the monthly-mean timescale. This is because rainfall is more sensitive to sub-monthly variations in the atmospheric flow, leading to changes in the timing and location of rainfall events. Over the 30 year time-series, in our deforestations scenario, however (figure 5), rainfall in both SACZ and SESA experiences large fluctuations in rainfall (extreme wetting or drying) at the individual monthly level with 5% of individual months having 20%–99% change in rainfall. Most changes over 25% occur between October–March for both areas (corresponding with the southerly moisture flow from the Guiana Shield, and the SACZ wet season) and mostly occur at least once every year, with several months experiencing precipitation changes of >40%. These fluctuations impact the number of dry months in LPB (especially in January, three) implying local lengthening or shortening of the dry-season.
Consequences of Guiana Shield deforestation across South America
Deforesting the Guiana Shield therefore has the potential to cause multiple consequences at the local and regional scales. Locally, in the Guiana Shield more intense and longer wet-seasons inland with prolonged and intense flooding in the Rupununi/Rio Branco savannah/wetlands region would severely impact remote (indigenous) communities for example by damaging subsistence crop production (such as cassava), reducing fish-catch and restricting road-travel and access to alternative supplies. It would also reduce water quality and promote water-borne diseases such as mosquito-related malaria, dengue fever, zika and chikungunya (e.g. International Federation of Red Cross and Red Crescent Societies 2008). Flooding would also impact the productivity of the extractive industries (gold mining, forestry) and negatively impact larger scale agriculture which is currently being promoted in the savannah. Further south, high discharges in the Rio Negro may enhance flood risks in Manaus (Espinoza et al 2014). In the east, along the coastal regions of the Guiana Shield where the majority of the population live, any drying and warming is likely to cause pressures on water-management during the dry season, directly impacting agriculture (particularly rice and sugar crops) on which local economies rely. Further afield in the west and southwest, wetting in Colombia during April−September may cause flooding, negatively affect economic activities (including coffee, fruit, cocoa and banana growing) and enhance the risks of landslides, whilst wetting and/or drying in the Amazon forest may lead to changes in the dry-season length, forcing shifts in tree composition and forest ecosystem stability noticeable in our lifetime (Sombroek 2001, ter Steege et al 2006, Feeley et al 2012). Changes in the rainfall pattern may also affect the structure and composition of the forests via edge-effects (Cumming et al 2012) and increased frequency of storms and downbursts that are a major mechanism of tree mortality in mature forests (Nelson et al 1994, Chambers et al 2013, Marra et al 2014, Negron-Juarez et al 2018). In the distant south of the LPB, enhanced extreme weather events (droughts and floods) would likely impact agriculture and therefore the economy of several countries.
Our study establishes that deforestation in the currently intact Guiana Shield, at a critical geographic location near the start of two atmospheric rivers, is likely to have significant remote impacts downstream. Stronger international efforts are therefore urgently needed to better understand and sustainably manage the Guiana Shield and other tropical forests in South America making use of mechanisms to value and finance such natural capital (Ebeling and Yasue 2008, van Noordwijk et al 2014, Pfaff et al 2015). Further research is needed to explore the impact of varying the orientation and size of deforestation (Lawrence and Vandecar 2015) as well as the effect of incorporating biogeochemical feedbacks. Use of ensembles of experiments and models would help assess both scenario and model uncertainty. This study focusses on South America, however, the generic processes and feedbacks identified may well also apply to other tropical and non-tropical systems, shifting the focus to climate sensitive local hotspots as key components of multi-scale climate and environmental change.
How likely is deforestation in the Guiana Shield and replacement by savannah?
The land-cover change scenario used in this study is based on expansion of the Rupununi-Rio Branco savannah (supplementary figure 1) and deforestation of existing or planned mining blocks (supplementary figure 2, see also Dezecache et al 2017) and assumes total forest removal and replacement by savannah.
This deforestation scenario is not extreme when compared to areas that have been deforested along the southern margin of Amazonia, recognising that overall it is estimated that ~20% of the Amazon rainforest has been replaced with pasture and other landcovers (see Davidson et al 2012). Although deforestation rates in the Guiana Shield forests have previously been low due to their inaccessibility, rates are now increasing in contrast to a general slowing of deforestation rates in Brazil (Nepstad et al 2009, Lapola et al 2014). In fact, the tropical forests of the Guiana Shield are currently the most affected by gold-mining in South America, with gold-mining accounting for 41% of total forest loss in the region (Alvarez-Berrios and Mitchell Aide 2015, Dezecache et al 2017). Increasing deforestation in the Guiana Shield is not only due to growing pressures from open-cast mining for gold, diamonds, iron and bauxite (Hammond et al 2007, Clifford 2011, Dezecache et al 2017), but also to selective timber logging (Veríssimo et al 2008, Ahmed and Ewers 2012), encroaching agricultural activities (Armenteras et al 2009), and new roads and infrastructure developments (Armenteras et al 2013). New pressures may also include oil and gas-related deforestation if onshore oil is discovered, following the discovery of Guyana's major offshore oil-reserves.
Forest and savannah biomes dominate the tropics, but factors controlling their natural (i.e. non-perturbed) distribution, especially at the regional to local scale, remain poorly understood (Oliveras and Malhi 2016), with some savannah areas shifting towards forest (Rutishauser et al 2015, Poorter et al 2016), and some forest areas tending towards savannisation (Silva et al 2010, Veldman and Putz 2011, Anadón et al 2014), depending on regional and local variations. Water availability is a key factor in determining the location of savannah, but evolutionary history, carbon dioxide concentrations, fire dynamics, herbivore pressure and soil properties also play important roles (Oliveras and Malhi 2016). At the northern boundary of the Amazonian forest, the Rupununi-Rio Branco savannah, running through northern Brazil to southern Guyana, marks an area where natural or anthropogenic activities could easily lead to expansion of the savannah boundaries. The forest-savannah boundary here is abrupt, and marks a general change in rainfall regime from a two wet season maritime climate over the coastal forests, to a continental climate with one wet season over the savannahs (Bovolo et al 2012). In mesic environments such as these, it has been postulated that savannah or 'treeless states' may represent stable alternatives to tropical forests (Hirota et al 2011, Staver et al 2011) and that the presence and maintenance of one state or the other may be related to disturbances such as fire, and tree shade-fire suppression feedbacks (Hoffmann et al 2012). However, human-created disturbances from pressures such as open-cast mining and logging as well climate-related changes such as altered rainfall regimes, length of dry season, increasing temperatures and rising CO2 levels, may act to push the system towards one particular state (Oliveras and Malhi 2016). For example, deforestation due to fire or felling could cause the spread of savannah into the forest (Tredennick and Hanan 2015, Staal et al 2016). Within the Guiana Shield, forests may also be particularly vulnerable to savannisation as the region already has poorer soils in comparison to the rest of the Amazon (ter Steege et al 2012) and disturbed 'open' areas are known to be prone to soil erosion (Labriere et al 2015). Also the Guiana Shield forest is characterised by high density trees with larger seeds (ter Steege et al 2006) which are relatively slow growing (Malhi et al 2006) and require a shady understory to thrive, unlike in other Amazon areas where small seeds tend to grow quickly in large gaps (van Ulft 2008)—therefore large open areas caused by deforestation may hamper primary forest regeneration. Changes in the location of the forest-savannah boundary, brought about by natural feedback mechanisms or anthropogenic land management may therefore lead to expansion of the savannah corridor as has happened in the past (Werneck et al 2012) and it is therefore possible, if not likely, that savannah could replace Guiana Shield rainforest in these regions in the future e.g. Salazar and Nobre (2010), Hoffmann et al (2012).
Methods
The RCM simulations of South America were performed using the UK Met Office's Hadley Centre for Climate Science and Services PRECIS model (Providing Regional Climates for Impact Studies (Jones et al 2004) based on a third-generation RCM (HadRM3P) (Massey et al 2015). PRECIS has been used successfully in a range of studies researching present and future regional climates worldwide (e.g. Roy et al 2015, Williams et al 2015, Almazroui 2013, Rao et al 2014, Deshpande and Kulkarni 2015, Taylor et al 2012, Narsimlu et al 2013, Patwardha et al 2012, Rajbhandari et al 2015). For example, it has been used within the CORDEX suite of RCMs (e.g. Awange et al 2013, Meque and Abiodun 2015, Owusu and Klutse 2013, Lejeune et al 2015) as well as in multiple weather@home projects as part of climateprediction.net (www.climateprediction.net/weatherathome/) (Massey et al 2015), resulting in multiple publications isolating human and natural influences on observed climate events (see e.g. Sippel and Otto 2014, Anel et al 2014, Rosier et al 2015, Black et al 2015, 2016, Bergaoui et al 2015, Marthews et al 2015, King et al 2015, Sippel et al 2015, Schaller et al 2016). Note that the weather@home modelling system uses the HadAM3P AGCM (Atmospheric General Circulation Model) and the HadRM3P RCM, which is the regional model used in PRECIS. The HadRM3P regional model has essentially the same model formulation and vertical resolution as HadAM3P, but increases the horizontal resolution to either 50 or 25 km). PRECIS performance over South America was evaluated separately by Marengo et al (2009) and Alves and Marengo (2010) who concluded that 'the model simulates well the spatial distribution of extreme temperature and rainfall events when compared with observations' and that 'the regional simulation reproduces reasonably well the spatial and temporal patterns of precipitation and temperature and the large-scale circulation'.
The model has 19 vertical atmospheric levels and was run at 0.44° resolution (approx. 50 km at the equator) for the whole of South America. The model uses the MOSES1 land-surface scheme (Cox et al 1999), where parameterization includes the hydrologic cycle and the effects of vegetation on energy and water fluxes by representing plant canopies, including radiative transfer, turbulent processes above and within the canopy and the physical and biological controls of evapotranspiration. Primary (50%–100%) and secondary (25%–50%) vegetation cover types for each grid cell are based on soil and land cover types derived from the WHS dataset (Wilson and Henderson-Sellers 1985).
The model was nested within the european centre for medium-range weather forecasting (ECMWF) ERA-Interim reanalysis (Dee et al 2011), a quasi-observed set of boundary data which provides horizontal wind components, temperature, water vapour and surface pressure at every time-step. ERA-Interim has been used with various RCMs, all of which have been shown to capture the spatial and temporal patterns of precipitation and temperature and the main features of large-scale circulation over South America, despite some biases (Solman et al 2013). Note that biases in the model become less important when comparing relative changes rather than absolute magnitudes. PRECIS performance was evaluated separately by Alves and Marengo (2010) with similar results (also see supplementary figure 16).
We ran the model for 31 years from 1st December 1979–30th November 2010 (discarding the first year as the spin-up period and the outer model rim for analysis purposes) for both a control simulation (no land-cover alterations) and the land-cover change scenario. The land-cover change scenario is based on expansion of the Rupununi-Rio Branco savannah (supplementary figure 1) and deforestation of mining areas currently under production, exploration or tender or open for bidding based on RAISG (2012) maps (supplementary figure 2). For the scenario, primary and/or secondary vegetation was altered by replacing the control vegetation (mostly equatorial rainforest) with tropical savannah so that the proportion of savannah was increased from approximately 14%–42% of the Guiana Shield (see figure 2(a), supplementary table 1, supplementary figure 2), altering the surface albedo, roughness and hydraulic properties of the roots and vegetated canopy (see Cox et al (1999) and Wilson and Henderson-Sellers (1985) for details). The design of our simulation allows us to isolate the biogeophysical land-atmosphere interactions responsible for climatic change across the continent. Biogeochemical processes (e.g. changes in atmospheric composition) (Bonan et al 2008), more important for global impacts (Devaraju et al 2015) are not simulated in our study. Such biogeophysical and biogeochemical impacts are, however, expected to amplify each other in the tropics (Jackson et al 2008) implying that our simulations represent a conservative approach.
We compared the land-cover change scenario against the control (no change) simulation. Mean differences in precipitation, temperature, evapotranspiration and runoff with respect to the control simulation were tested under the assumption that multi-annual (30-year) monthly means have a normal distribution using an unpaired two-tailed Student's t-test (e.g. Kanae et al 2001, Werth and Avissar 2002, Costa and Pires 2010, Canziani and Benitez 2012) with n = 30. Evapotranspiration was calculated as the sum of evaporation from the soil surface and canopy, plus transpiration. All model data was re-gridded to a regular 0.5° × 0.5° resolution for manipulation and display.
Acknowledgments
We thank: Andrew Mitchell for initial discussions in developing the concept; Chris Kilsby, Michael W Douglas and Richard Betts for discussions in developing the work and for reviews of early draft manuscripts; Iain Woodfine and Simon Wilson for technical support in running the model; and Rosanna Amato for helping to process datasets. CIB was funded by the Newcastle University Institute for Sustainability. TW acknowledges support from the Royal Society Wolfson Research Merit Award. Provision of the PRECIS model and driving data by the Met Office is noted with thanks.