


The aim of this study is to develop models to aid the decision to prolong dual antiplatelet therapy (DAPT) that requires balancing an individual patient’s potential benefits and harms.
Using population-based electronic health records (EHRs) (CALIBER, England, 2000–10), of patients evaluated 1 year after acute myocardial infarction (MI), we developed (n = 12 694 patients) and validated (n = 5613) prognostic models for cardiovascular (cardiovascular death, MI or stroke) events and three different bleeding endpoints. We applied trial effect estimates to determine potential benefits and harms of DAPT and the net clinical benefit of individuals. Prognostic models for cardiovascular events (c-index: 0.75 (95% CI: 0.74, 0.77)) and bleeding (c index 0.72 (95% CI: 0.67, 0.77)) were well calibrated: 3-year risk of cardiovascular events was 16.5% overall (5.2% in the lowest- and 46.7% in the highest-risk individuals), while for major bleeding, it was 1.7% (0.3% in the lowest- and 5.4% in the highest-risk patients). For every 10 000 patients treated per year, we estimated 249 (95% CI: 228, 269) cardiovascular events prevented and 134 (95% CI: 87, 181) major bleeding events caused in the highest-risk patients, and 28 (95% CI: 19, 37) cardiovascular events prevented and 9 (95% CI: 0, 20) major bleeding events caused in the lowest-risk patients. There was a net clinical benefit of prolonged DAPT in 63–99% patients depending on how benefits and harms were weighted.
Prognostic models for cardiovascular events and bleeding using population-based EHRs may help to personalise decisions for prolonged DAPT 1-year following acute MI.
Introduction
Among patients who survived a year since their last acute myocardial infarction (MI), subsequent major cardiovascular events, all-cause mortality and major bleeding risks are high.1,2 In unselected populations in USA, Sweden, England, and France, 20% of such patients experienced subsequent MI, stroke, or died during the following 3 years.2 Prolonged secondary prevention therapy in such patients is already recommended for four classes of drugs (statins, beta-blockers, ACE inhibitors, and aspirin). Recent trials3,4 examined addition of an extra antiplatelet. The PEGASUS-TIMI 54 trial4 found prolonged dual antiplatelet therapy (DAPT) using aspirin and ticagrelor compared with aspirin alone in patients 1–3 years since their last acute MI reduced the risk of cardiovascular death, stroke, or MI by 16% but increased major bleeding two-fold. In light of this evidence, 2015 European Society of Cardiology guidelines recommend prolonged DAPT may be ‘considered after careful assessment of ischaemic and bleeding risks’.5,6
How to make this ‘careful assessment’ is unclear. Risk prediction modelling has been proven invaluable in conditions such as atrial fibrillation where similar decisions on benefits and harm need to be weighed.7 Indeed, such models for bleeding and subsequent MI have been developed to guide use of bivalirudin,8 the choice of P2Y12 inhibitor,9 and duration of DAPT.10,11 An existing model intended to guide the duration of DAPT is based on patients undergoing drug eluting stent placement and selected into a trial and uses patient characteristics at the time of percutaneous coronary intervention.11 Currently, no prognostic models evaluate the long-term risks of bleeding and cardiovascular events using updated clinical information 1 year after acute MI, to support the key clinical decision on prolonging DAPT.
In this context, unselected populations are important to provide realistic estimates of long-term cardiovascular and bleeding risks; these estimates are often substantially higher than those observed in the placebo arms of trials.12–14 Linked electronic health records (EHRs) are ideal sources of data to derive such ‘real-life’ estimates of risks and harms, at scale. The CALIBER dataset,15 validated for cardiovascular prognostic research,16–18 is a 2 million person resource of linked primary–secondary and mortality data in England including 18 307 MI survivors.
Among these stable MI survivors, we sought to first, develop and validate prognostic models for major cardiovascular and bleeding events. We used prognostic factors present 1 year following acute MI and widely recorded as a part of guideline recommended care. Second, to demonstrate how predicted benefits and harms may aid treatment and clinical decisions, we applied PEGASUS-TIMI 54 trial4 relative risks of efficacy and safety to estimate potential numbers of cardiovascular events prevented and harms caused by prolonged DAPT, and net clinical benefits for individuals.
Methods
The models were developed and validated in line with Transparent Reporting of a multivariable prediction model for Individual Prognosis Or Diagnosis (TRIPOD) guidelines19 (see Supplementary material online, Table S1).
Linked EHRs
We used the CALIBER (ClinicAl research using LInked Bespoke and Electronic health Records) research platform, consisting of EHR linkages between primary care data (Clinical Practice Research Datalink (CPRD)), secondary care data (Hospital Episode Statistics), disease registry data (Myocardial Ischaemia National Audit Project), and cause-specific mortality (Office for National Statistics) in England.15 The 4% sample of England’s population in CPRD available for linkage is unselected, representative in terms of age, sex, and overall mortality.20–22 Furthermore, there is extensive evidence of risk factor and cardiovascular and non-cardiovascular disease endpoint validity in CALIBER.16–18,23–27 The study was approved by the Independent Scientific Advisory Committee of the Medicines and Health care products Regulatory Agency in the UK and the MINAP Academic Group.
Study population
Patients in CALIBER alive 1 year after their last acute MI (i.e. their index acute MI) were included in the study. We studied patients from 2000 to 2010, before the introduction of ticagrelor, and when prolonged DAPT was rare. Follow-up started at 1 year after index acute MI, and patients were censored at the earliest date of the endpoints of interest, primary care practice transfer, death, or 5 years of follow-up. We evaluated prescriptions indicating prolonged clopidogrel use in follow up (defined in Supplementary material online, Table S2) in our cohort to ensure they were untreated with long-term DAPT i.e. the decision our models aimed to aid. Patients were split into model development and validation cohorts using a pre-specified geographical divide.28 The North of England has well-documented higher rates of cardiovascular mortality compared with the South.29 Based on the 10 administrative areas in the National Health Service, we chose 6 in the South for model development cohort and 4 in the North for model validation cohort.
Potential prognostic factors
In model development, we considered a priori prognostic factors including demographics, behaviours, cardiovascular and non-cardiovascular medical history, medications, and clinical biomarkers. Each patient’s most recent biomarker records in the year from index acute MI to follow-up start were used. Medications were defined as having ≥1 prescription of a drug in the year prior to follow-up start. As a patient’s risk profile evolves with time (risk at index event and at one year may differ), we also analysed risk characteristics at the time of hospital discharge from index acute MI. Details on data sources and EHR phenotypes for prognostic factors are available at the CALIBER online portal (https://www.caliberresearch.org/portal/, 10 January 2017) and see Supplementary material online, Table S2.
Endpoints
The primary endpoint relating to potential benefits of prolonged DAPT, a composite of cardiovascular death, MI, or ischemic or unspecified stroke, have validated phenotypes in CALIBER.16,17,23 For examining potential harms of prolonged DAPT, we evaluated three severe bleeding endpoints with differing incidence: (1) fatal or hospitalised bleeding; (2) CALIBER major bleeding (a composite of fatal bleeding, intracranial bleeding, hospitalised bleeding with length of stay exceeding 14 days and bleeding requiring transfusion); and (3) fatal or intracranial bleeding (see Supplementary material online, Table S3). We also evaluated models for all-cause mortality.
Statistical analysis
Model development
We evaluated associations between endpoints and prognostic factors using proportional hazards models with Weibull baseline hazards. Univariable models were used to detect non-linear trends and inform inclusion of prognostic factors in multivariable models. Non-linear continuous prognostic factors were included in the model using restricted cubic splines. We chose the number of knots based on descriptive plots in the univariable analysis to provide a sufficient balance between capturing accurate shape and without overfitting.30 We used three knots (a sensitivity analysis using five knots resulted in very similar predictions). Proportional hazard assumptions were checked using residual and log(−log) plots. For non-normally distributed continuous prognostic factors, sensible functional form was obtained by log transformation. For parsimony, backwards selection methods were employed for constructing multivariable models, in which all prognostic factors were initially included, and removed stepwise if P > 0.1. Variance inflation factors were calculated to detect evidence of multicollinearity problems in the model selection process. Known important prognostic factors (age, gender, smoking status, index acute MI subtype, diabetes, history of MI prior to index acute MI, and stroke) were retained in all models. Missing values were multiply imputed using MICE (Multiple Imputation by Chained Equations).31 Thirty imputed sets were generated using all baseline covariates (demographics and behaviours, disease history, clinical biomarkers, and prescribed drugs) in the models.
Model validation
Models were validated using our geographically external North of England population. Unequal sized groups can minimise information loss when categorising compared with equal groupings,32 we, therefore, grouped patients into four risk groups (highest, high, low, and lowest) using cut-points at the 16th, 50th and 84th percentiles of the development cohort linear predictor.33 C-indexes estimated models discrimination. Model calibration was assessed visually by comparing plots of model expected events with validation cohort observed events, stratified by the risk group.
Model application
We applied relative risks for efficacy (cardiovascular death, stroke, or MI) and safety (TIMI major bleeding and fatal or intracranial bleeding) for ticagrelor 60 mg vs. placebo from the PEGASUS-TIMI 54 trial4 to the validation cohort stratified by predicted risk groups to estimate the potential events prevented and harms caused per 10 000 patients treated per year. We assume constant treatment effect across risk groups. We calculated net cardiovascular death, stroke, or MI and net CALIBER major bleeding risks with treatment for each individual in the validation cohort using the trial relative risk estimates. We evaluated predicted net benefit in patients (i.e. estimated cardiovascular risk decrease exceeds bleeding risk increase) under different benefit and harm weighting scenarios.9,34 Analyses were performed using R version 3.0.2.
Results
Baseline characteristics and overall event rates
The model development cohort consisted of 12 694 patients (mean age 70.1 years, 66.1% male) from 159 general practices, median follow-up of 3.1 years (range: 0–9.8) and 27% followed-up for at least 5 years (Table 1 and see Supplementary material online, Figure S1). The validation cohort consisted of 5613 patients (mean age 69 years, 64.4% male) from 61 general practices. Overall, approximately 3% of patients had prolonged clopidogrel use in follow-up. Patient characteristics of the cohorts changed from acute MI discharge to our baseline of 1-year post-MI including increased heart failure and renal disease prevalence and changed smoking statuses (see Supplementary material online, Table S4). The cardiovascular and bleeding event rates from one-year post-MI in the development and validation cohorts are shown in Supplementary material online, Figure S2.
Characteristics of population-based samples of patients at baseline defined as 1 year after their last acute MI
| Development cohort (n=12 694) | Validation cohort (n=5613) | |
|---|---|---|
| Demographics and behaviours | ||
| Age (years) | 70.1 (12.7) | 69.1 (12.8) |
| Women | 33.9% | 35.6% |
| Ethnicity | ||
| Asian | 2.0% | 1.1% |
| Black | 0.5% | 0.1% |
| Other | 17.0% | 14.1% |
| White | 80.4% | 84.6% |
| Index of multiple deprivation (highest quartile- most deprived) | 15.4% | 30.3% |
| Smoking status | ||
| Ex-smoker | 49.3% | 50.0% |
| Non-smoker | 36.7% | 34.2% |
| Smoker | 14.0% | 15.8% |
| Excess alcohol | 10.8% | 15.4% |
| Cardiovascular diseases | ||
| Index acute MI subtype | ||
| NSTEMI | 32.1% | 29.1% |
| STEMI | 17.4% | 16.4% |
| Unspecified | 50.5% | 54.5% |
| MI (prior to index acute MI) | 34.7% | 38.7% |
| Revascularisation (any) | 43.5% | 33.0% |
| Primary PCI for index acute MI | 24.8% | 18.8% |
| PCI at any time prior to 1 year post MI | 39.4% | 31.0% |
| CABG at any time to 1 year post MI | 4.1% | 2.0% |
| Stroke | 6.9% | 8.1% |
| Atrial fibrillation | 18.0% | 17.9% |
| Heart failure | 23.5% | 28.0% |
| Peripheral arterial disease | 9.8% | 13.1% |
| Renal disease | 13.6% | 14.8% |
| Recent hospitalisation for acute renal disease | 1.3% | 1.0% |
| Non-cardiovascular diseases | ||
| Diabetes | ||
| Type 1 | 1.2% | 0.9% |
| Type 2 | 16.7% | 17% |
| Unspecified | 1.5% | 1.7% |
| COPD | 9.1% | 12.8% |
| Recent hospitalisation for acute COPD | 1.1% | 2.2% |
| Liver disease | 0.4% | 0.5% |
| Non-metastatic cancer | 14.4% | 13.2% |
| Metastatic cancer | 1.0% | 1.2% |
| Dementia | 1.3% | 2.0% |
| Chronic anaemia | 14.3% | 17.9% |
| Peptic ulcer | 7.3% | 10.2% |
| Bleeding diatheses and coagulation disorders | 1.1% | 1.1% |
| Hospitalised bleeding | 6.5% | 8.2% |
| Treatments prescribed | ||
| Aspirin | 87.0% | 86.2% |
| Clopidogrel | 50.5% | 47.8% |
| Prolonged clopidogrel, post-baseline | 2.7% | 3.4% |
| Oral anticoagulant | 9.9% | 9.5% |
| Statin | 88.5% | 88.6% |
| Anti-hypertensive | 96.4% | 96.0% |
| Biomarkers | ||
| BMI (Continuous) (kg/m2) | 27.8 (5.1) | 27.7 (5.1) |
| BMI (Categorical) | ||
| Underweight | 1.5% | 1.8% |
| Normal | 28.7% | 28.4% |
| Overweight | 41.2% | 42.2% |
| Obese | 28.6% | 27.7% |
| SBP (mmHg) | 133 (18.6) | 132 (18.4) |
| DBP (mmHg) | 75.3 (10.4) | 74.6 (10.1) |
| Haemoglobin (g/dl) | 13.4 (1.6) | 13.3 (1.6) |
| White blood cell count (109/l) | 7.60 (2.3) | 7.68 (2.3) |
| Total cholesterol (mmol/l) | 4.17 (1.0) | 4.17 (1.0) |
| HDL cholesterol (mmol/l) | 1.28 (0.4) | 1.26 (0.4) |
| Creatinine (μmol/l) Median (IQR) | 98 (84, 114) | 99 (86, 117) |
| eGFR (ml/min) | 65.5 (20.3) | 64.7 (20.7) |
| eGFR < 60 ml/min | 38.7% | 41.2% |
Values are mean (SD) except where stated.
MI, myocardial infarction; STEMI, ST-elevation myocardial infarction; NSTEMI, non-ST-elevation myocardial infarction; PCI, Percutaneous coronary intervention; CABG, Coronary artery bypass graft; COPD, chronic obstructive pulmonary disease; BMI, body mass index; SBP, systolic blood pressure; DBP, diastolic blood pressure; HDL, high-density lipoprotein; eGFR, estimated glomerular filtration rate.
Development of prognostic models
![Prognostic factors (multivariable) for 5-year cardiovascular death stroke or MI, fatal or hospitalised bleeding, CALIBER major bleeding and fatal or intracranial bleeding endpoints. CV, cardiovascular; MI, myocardial infarction; ref, reference group; NSTEMI, non-ST-elevation myocardial infarction; STEMI, ST-elevation myocardial infarction; PCI, percutaneous coronary intervention; CABG, coronary artery bypass graft; BMI, body mass index; HDL, high-density lipoprotein; exc., excluding; log hazard ratios compared with [ref] group for categorical factors or per unit increase for continuous factors; for hazard ratios and 95% confidence intervals see Supplementary material online, Table S4. Systolic blood pressure was included in all models using restricted cubic splines (see Supplementary material online, Table S5).](https://oup.silverchair-cdn.com/oup/backfile/Content_public/Journal/eurheartj/38/14/10.1093_eurheartj_ehw683/2/m_ehw683f1.jpeg?Expires=1716323466&Signature=hi7yRQ~nArLDlFdYDqgmpKTuS-NvgMPku8SjvWVh2g6nO2~hICdzNuRPyvZCbdEj94Y-MC3GUhXtrDiOnwVVyJRGb4Xsbs-AytX6~yj5HTomcbKk7vOYDarGePX7o5v3qIkiIlQHPd-zcy-MUbA3l1A7TgXFnv9eV-XV3kdZ8MC1u8nWu7ARwCPGmvIc1v5ZX3yFa6-hPX5FbG2m3IoS6yiVt-kauAmuvME0LBEoxE4lc5yh4mgBu4r081FjQeSrdNH1XAfQIJkNF~u7zkvBtTYZAtw6OAmcQITG~8k3Gy22kXDzSc~HMd5-zjV67ZuvUa4hRJdhqh8tdFJ2sZRhKA__&Key-Pair-Id=APKAIE5G5CRDK6RD3PGA)
Prognostic factors (multivariable) for 5-year cardiovascular death stroke or MI, fatal or hospitalised bleeding, CALIBER major bleeding and fatal or intracranial bleeding endpoints. CV, cardiovascular; MI, myocardial infarction; ref, reference group; NSTEMI, non-ST-elevation myocardial infarction; STEMI, ST-elevation myocardial infarction; PCI, percutaneous coronary intervention; CABG, coronary artery bypass graft; BMI, body mass index; HDL, high-density lipoprotein; exc., excluding; log hazard ratios compared with [ref] group for categorical factors or per unit increase for continuous factors; for hazard ratios and 95% confidence intervals see Supplementary material online, Table S4. Systolic blood pressure was included in all models using restricted cubic splines (see Supplementary material online, Table S5).
Validation of prognostic models
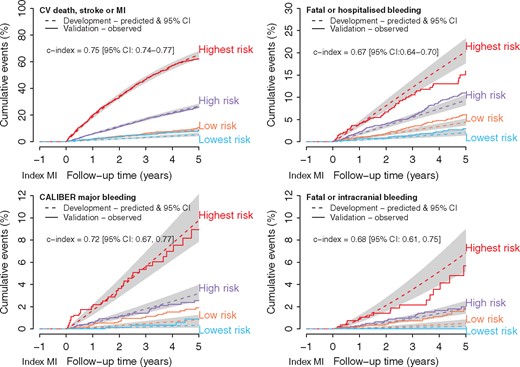
Geographical validation; calibration of cardiovascular and bleeding prognostic models by risk group. CV, cardiovascular; MI, myocardial infarction; CI, confidence interval.
Potential absolute benefits and harms in risk groups
We observed higher event rates in our study cohort compared with the trial placebo group for cardiovascular death, stroke, or MI (16.5% vs. 9.04%) and major bleeding (CALIBER 1.7% vs. TIMI 1.26%) events. Table 2 shows on an intention-to-treat basis in highest risk groups, for every 10 000 patients treated per year, 249 (95% CI: 228, 269) cardiovascular events may be prevented and 134 (95% CI: 87,181) major bleeding events may be caused, whereas in the lowest risk groups 28 (95% CI: 19, 37) cardiovascular events may be prevented and 9 (95% CI: 0, 20) major bleeding events may be caused. In the absence of risk stratification, we estimated 89 (95% CI: 83, 94) cardiovascular events prevented and 42 (95% CI: 32, 51) harmed patients per 10,000 treated per year. Fatal or intracranial bleeding occurred in 2.2% of high-risk patients and fatal or hospitalised bleeding occurred in 10.5% of high-risk patients.
Estimated events prevented and harms caused per 10 000 patients treated per year with prolonged dual antiplatelet therapy by predicted risk groups compared with all risk groups combined and the PEGASUS-TIMI 54 trial population
| Unselected population | Trial population | |||||
|---|---|---|---|---|---|---|
| Risk groups as defined by prognostic models | ||||||
| in the validation cohort (n=5613) | ||||||
| Lowest | Low | High | Highest | All | PEGASUS-TIMI 54 placebo arm | |
| Potential benefits | ||||||
| Cardiovascular death, stroke, or MI | ||||||
| 3 year cumulative risk, % (95% CI) | 5.2 (3.4, 6.9) | 6.3 (5.0, 7.5) | 17.1 (15.2, 19.0) | 46.7 (42.7, 50.3) | 16.5 (15.4, 17.6) | 9.04 |
| Events potentially prevented (95% CI) (ITT) | 28 (19, 37) | 34 (27, 41) | 92 (81, 102) | 249 (228, 269) | 89 (83, 94) | 42 |
| Potential harms | ||||||
| CALIBER major bleeding | ||||||
| 3-year cumulative risk, % (95% CI) | 0.3 (0.0, 0.8) | 1.0 (0.5, 1.5) | 1.4 (0.8, 2.0) | 5.4 (3.5, 7.2) | 1.7 (1.3, 2.0) | 1.26a (ITT); 1.06a (OT) |
| Harms potentially caused (95% CI) (ITT) | 9 (0, 20) | 26 (14, 39) | 36 (21, 51) | 134 (87, 181) | 42 (32, 51) | 31 |
| Harms potentially caused (95% CI) (OT) | 15 (0, 35) | 46 (24, 68) | 63 (36, 89) | 236 (153, 318) | 73 (56, 90) | 47 |
| Fatal bleeding or intracranial bleeding | ||||||
| 3- year cumulative risk, % (95% CI) | 0 | 0.7 (0.3, 1.1) | 1.1 (0.5, 1.6) | 2.2 (0.9, 3.4) | 0.9 (0.6, 1.2) | 0.60 |
| Harms potentially caused (95% CI) (OT) | – | 5 (2, 8) | 8 (4, 11) | 15 (7, 23) | 7 (5, 9) | 4 |
| Fatal or hospitalised bleeding | ||||||
| 3-year cumulative risk, % (95% CI) | 1.4 (0.5, 2.3) | 3.3 (2.4, 4.3) | 5.8 (4.5, 7.0) | 10.5 (8.0, 13.0) | 4.9 (4.3, 5.6) | Not availableb |
Note: PEGASUS-TIMI 54 trial estimated relative risks [ticagrelor 60 mg vs. placebo; intention-to-treat (ITT) and on treatment (OT) estimates where available] for cardiovascular death, stroke, or MI [ITT: 0.84, main report], TIMI major bleeding [ITT: 1.75, appendix E; OT: 2.32, main report], fatal bleeding or intracranial bleeding [OT:1.20, main report] were used to calculate CV events potentially prevented and harms potentially caused per 10 000 treated per year.
TIMI-major bleeding.
No broad/composite bleeding endpoint reported in PEGASUS-TIMI 54.
Potential net clinical benefits in individuals
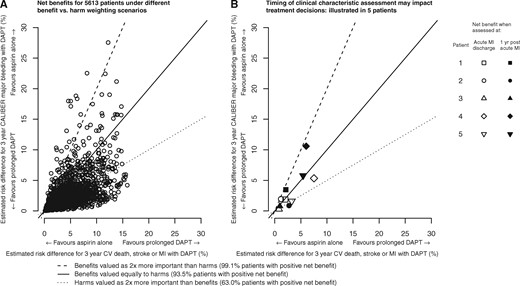
Net predicted risk for cardiovascular death, stroke, or MI and CALIBER major bleeding with prolonged dual antiplatelet therapy. MI, Myocardial infarction; CV, cardiovascular; DAPT, dual antiplatelet therapy. The straight lines correspond to different scenarios of how patients or clinicians may value (or weight) benefits and harms. All patients to the right of a line applicable to their values would be estimated to have a positive net benefit with prolonged DAPT. Panel A: Net benefit for 5613 patients under different benefit vs. harm weighting scenarios. Panel B: Timing of clinical characteristic assessment may impact treatment decisions shows the net benefits calculated using patient characteristics at discharge from acute MI and at 1 year post-acute MI for 5 ‘typical’ patients in the validation cohort (see Supplementary material online, Table S4).
Discussion
Using population-based linked EHRs, we developed and validated prognostic models providing personalised estimates of risks of major cardiovascular and bleeding events in patients 12 months after an acute MI. With trial relative risks, we estimated potential benefits and harms of prolonged DAPT across risk groups. In individuals, potential net clinical benefit was observed for the majority of patients, even when avoiding bleeding is considered twice as important as preventing cardiovascular events; however, the magnitude of benefit must also be considered.
Potential cardiovascular event prevention
Our unselected study cohort experienced a much higher cardiovascular event rate than the PEGASUS-TIMI 54 trial placebo group despite the trial inclusion criteria enriching for high risk.35 Thus, the potential absolute benefit of prolonged DAPT may be greater than reported in the trial. Importantly, potential benefits are comparable when the unselected real-world study population reported here is restricted to those meeting the trial inclusion and exclusion criteria (89 vs. 101 events potentially prevented per 10 000 treated per year, respectively).35 Our models widely separated the risk of events: a clinician may treat nine times (28/249) as many patients in the lowest-risk, compared with the highest-risk group, to prevent one cardiovascular event. Our models help clarify limitations of ignoring individual patient characteristics evaluated during the stable phase post-acute MI.
Potential bleeding harms
In balancing potential harms from prolonged DAPT, we show the importance of considering different bleeding endpoints. While all bleedings we studied may be considered serious (they all required hospitalisation), their event rates and potential harms vary significantly. We sought to approximate the PEGASUS-TIMI 54 trial primary safety endpoint, TIMI major bleeding, and successfully defined fatal bleeding, intracranial bleeding and transfusions, but not, in currently available EHR, acute haemoglobin change. Nonetheless, incidence of CALIBER major bleeding was comparable with TIMI major bleeding in the trial placebo arm.
Balancing potential benefits and harms in individuals
Patients and clinicians differ in how they value different benefits and harms, and we derived net clinical benefit estimates under different weighting scenarios. These can inform patient counselling and patient–doctor discussions tailored to patients risk covariates. Cost-effectiveness considerations are additionally important in determining the magnitude of net clinical benefit a given health system is willing to pay for.36,37
Need for multivariable risk prediction
The importance of tailoring risk to multiple patient characteristics, as opposed to single risk factors (e.g. age, diabetes, history of MI and renal disease)38 is illustrated in Supplementary material online, Figure S6. In each case, the risk distribution largely overlaps among people with and without simple binary prognostic factors. Furthermore, while simple, point-based scores for predicting bleeding risk prove valuable for other diseases,39,40 they are unlikely to be useful for this population. For example, we found HASBLED7 performed poorly in our stable post-MI cohort (c-index 0.57). It is well-known categorising clinical information loses predictive value and systolic blood pressure has non-linear U-shaped associations with endpoints (see Supplementary material online, Figure S5 and Table S6)41 consistent with lower blood pressure reflecting impaired left ventricular function and therefore higher risk. Nonetheless in practice some simplification of our models will occur as absolute contraindications are established (e.g. although we adjusted for history of bleeding in our models, patients who bleed in the first year should be excluded from the prolonged DAPT treatment option).
Application in clinical practice
We demonstrate marked changes in the year following acute MI in the prevalence of major prognostic factors, including heart failure, renal disease and smoking, with consequent changes in net benefits. Good clinical practice dictates thorough evaluation of patients at the time of decision-making including up-to-date medical history and biomarkers. Our models can be readily implemented in health systems with EHR.42 We present a web-based tool providing personalised risk predictions at http://www.caliberresearch.org/prolonged_dapt_benefits_harms_risks (10 January 2017).
Methodological strengths
Few, if any, previous studies evaluated prognostic relevance of clinical data available at the decision point of surviving 1 year following an acute MI. Previous studies focused on factors measured in the acute hospitalised phase. Unlike voluntary disease registries or trial populations which may not reflect the entire population at risk, CALIBER is population based. Therefore, estimates of risk obtained are likely to be representative of those observed in usual clinical practice. Routinely collected clinical information readily available in EHR enabled estimation of changing net clinical benefit of prolonged DAPT during patient journeys. We have shown previously extensive evidence of the diagnostic and prognostic validity of the EHR sources in studies of acute myocardial infarction, stroke and bleeding endpoints.14,16,17,23
Limitations
Our study has important limitations. First, the information that is recorded as part of usual clinical practice is unlikely to have the same precision as that recorded as part of standardised research protocols. If the quality of information recording is low, then this will diminish the ability of the models to discriminate risk. Second, current large-scale population-based EHR data lack information on left ventricular function, number of diseased vessels, coronary stent type, and diameter. However it is not known if such factors remain prognostically relevant when included in models with updated clinical information at 1-year post-MI. There is extensive evidence that stent type (bare metal, drug eluting, and bioabsorbable) is an important predictor of prognosis from the time of acute myocardial infarction, and this study was unable to evaluate whether, in the stable phase 12 months after acute myocardial infarction, at a time, when we demonstrate that clinical factors have changed, stent characteristics continue to provide incremental discrimination of risk. Previous nationwide studies of angiographic findings suggest only a modest predictor of subsequent events in stable patients.43 Furthermore, we did not validate our models in different health systems. However, a study of 140 000 unselected stable post-MI patients found similar rates of cardiovascular and bleeding events in England, France, Sweden, and USA2 and the effects of multiple prognostic factors reported in the present study were consistent across these four countries, suggesting potential geographic transportability of our models. We used multiple imputations where appropriate and our complete-case sensitivity analysis showed no important difference to our presented models. Multiply imputing MI type for those unspecified did not show any difference to the ST-elevation MI vs. non ST-elevation MI contrast presented in our multivariable models.
Future research
We propose three major avenues for future research. First, further validation studies are recommended in populations differing in background, treatment strategies, and event rates to ensure generalisability.43 We selected a study period to provide a relatively pure population, prior to the UK approval of ticagrelor and widespread occurrences of prolonged DAPT. Further research is required to test our models in more recent cohorts with a mix of clopidogrel, ticagrelor, and prasugrel users and risk prediction models may be required for other harms (e.g. dyspnoea in patients taking ticagrelor). Second, as with any prognostic model the question arises of what is their impact on clinical outcomes and costs36,37 when implemented in clinical care.44 This would involve developing clinical decision support systems using prognostic models, and evaluation through a cluster randomised controlled trial. Third, there is a need to identify biomarkers which distinguish bleeding from cardiovascular event risks and may further aid decision-making.
Conclusion
Using population-based EHRs, we developed and validated prognostic models for benefits and different bleeding harms, relevant to the decision to prolong DAPT in patients stable 1 year after an acute MI. Personalised treatment decisions, based on individual patient risk profiles, can inform decision-making.
Funding
AstraZeneca, the Medical Research Council Prognosis Research Strategy (PROGRESS) Partnership (HH, Grant G0902393/99558), Medical Research Council Population Health Scientist Fellowship (S-CC: Grant MR/M015084/1), and by awards to establish the Farr Institute of Health Informatics Research, London, from the Medical Research Council, Arthritis Research UK, British Heart Foundation, Cancer Research UK, Chief Scientist Office, Economic and Social Research Council, Engineering and Physical Sciences Research Council, NIHR, National Institute for Social Care and Health Research, and Wellcome Trust (LP, S-CC, MP). The views expressed in this paper do not necessarily represent the views of the funding bodies. L.P. had full access to the data and take(s) responsibility for the integrity of the data and the accuracy of the data analysis. All authors had final responsibility for the decision to submit for publication. H.H. received funding from AstraZeneca to carry out this research project.
Conflict of interest: The sponsors did not have access to the data used and had no role in data collection, data curation, or analysis. The sponsors did comment on manuscript drafts but final decisions for analysis and publication were the responsibility of the authors.
References
Author notes
See page 1056 for the editorial comment on this article (doi: )

