Markets
Visualizing Corruption Around the World
Visualizing Corruption Around the World
Growing levels of public sector corruption can stifle a country’s economic growth while also chipping away at political freedom.
Which parts of the world are perceived to be most corrupt – and further, how does this data differ between regions, and how has it trended over time?
The Corruption Perception Index (CPI)
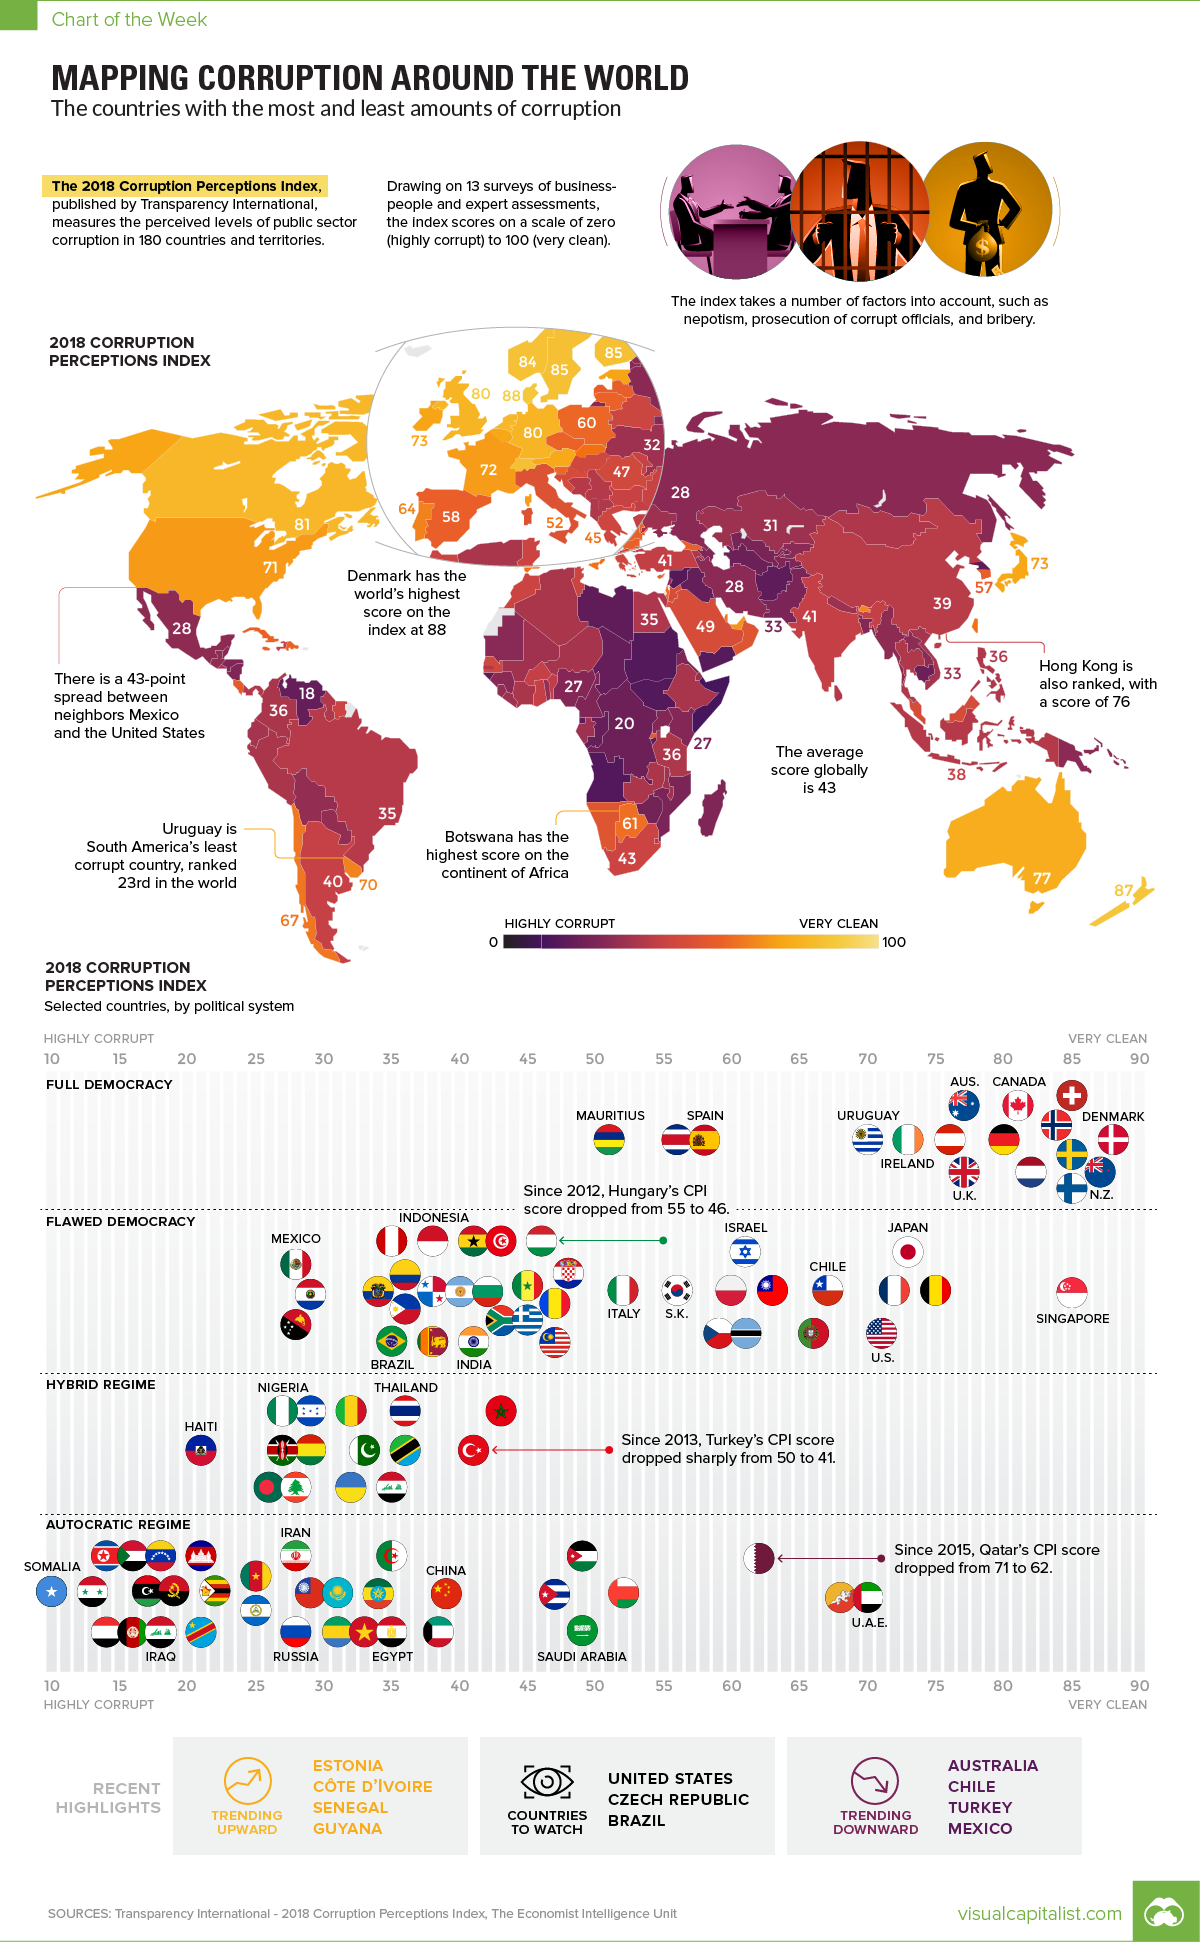
Today’s chart pulls its numbers from the recent 2018 Corruption Perceptions Index report, which has been published by Transparency International annually since 1995. The report scores 180 countries, and is considered the world’s most widely-used barometer for corruption.
However, before we dive in to the data, it’s worth taking a quick look at the methodology behind the report:
Methodology:
- The CPI attempts to measure perceptions about corruption in a country, rather than corruption itself
- Specifically, it is focused on the public sector of countries, which includes governments and government-run institutions
- The CPI is a composite index, using the results from 13 separate reports and surveys to calculate an overall score
- Scores range from 0 (most corrupt) to 100 (most clean)
Finally, it’s also worth noting that in the chart, we’ve added in government types as rated by the Economist Intelligence Unit – they range from “Full Democracy” to “Autocratic Regime”.
The Most and Least Corrupt Places
What do experts and businesspeople see as the most and least corrupt global regions?
| Region | Average Score (CPI) |
|---|---|
| Western Europe & EU | 66 |
| Americas | 44 |
| Asia Pacific | 44 |
| Middle East & North Africa | 39 |
| Eastern Europe & Central Asia | 35 |
| Sub-Saharan Africa | 32 |
| Global | 43 |
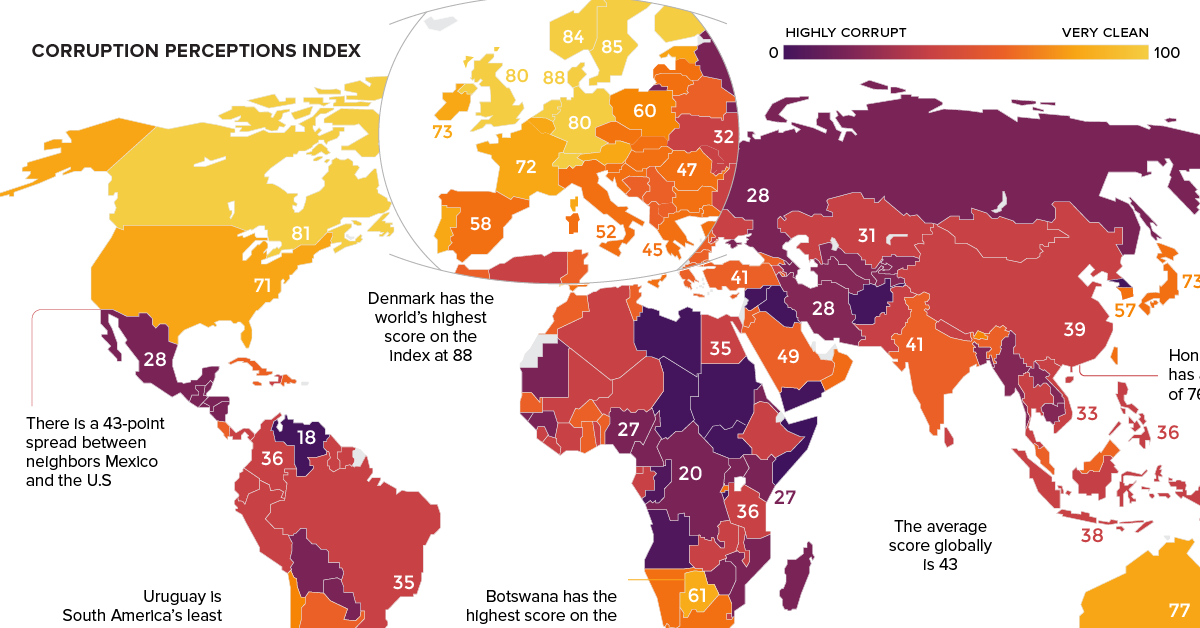
Western Europe has the highest score on average, while Sub-Saharan Africa has the lowest (most corrupt) average score. The Americas ranks just above the global average score of 43, mainly because the average is skewed by the lower scores of many countries in Latin America (such as Venezuela) and the Caribbean (such as Haiti).
Now, let’s look at the top 10 countries overall:
| Rank | Country | Score (CPI) | Government type | Region |
|---|---|---|---|---|
| #1 | Denmark | 88 | Full democracy | Western Europe & EU |
| #2 | New Zealand | 87 | Full democracy | Asia Pacific |
| #3 | Finland | 85 | Full democracy | Western Europe & EU |
| #3 | Singapore | 85 | Flawed democracy | Asia Pacific |
| #3 | Sweden | 85 | Full democracy | Western Europe & EU |
| #3 | Switzerland | 85 | Full democracy | Western Europe & EU |
| #7 | Norway | 84 | Full democracy | Western Europe & EU |
| #8 | Netherlands | 82 | Full democracy | Western Europe & EU |
| #9 | Canada | 81 | Full democracy | Americas |
| #9 | Luxembourg | 81 | Full democracy | Western Europe & EU |
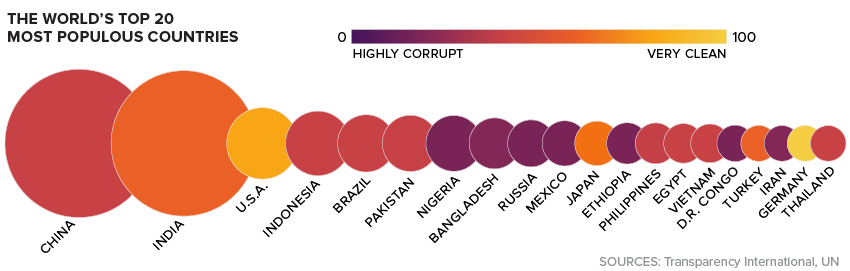
Here’s also a look at the world’s 20 most populous countries:
As the report notes, the relation between democracy and corruption appears to be quite clear: the more democratic a regime is, the less corrupt it is perceived to be. Using the Economist Intelligence Unit rankings, there are no “Hybrid” or “Autocratic” regimes that come anywhere near the top 10.
The closest may be the U.A.E. – which is classified as an Autocratic Regime – which has a CPI score of 70, good for 23rd place globally.
Trends Over Time
Over the last seven years, the report notes that there were a few specific countries that have consistently trended in one direction or another.
Hungary: The country has seen a -9 point change to its CPI score since 2012, dropping to 46 points in total. That’s just a notch above the global average.
Turkey: Turkey’s rating has deteriorated from 49 to 41 over the 2012-2018 time period.
Argentina: The South American nation has seen its score rise by eight points over the 2012-2018 time period.
Guyana: Guyana has gained nine points – a significant improvement over its original score of 28 at the start of that time period.
What will be the next country to jump up (or down) the list – and what factors will lead to this change in perception?
Note: The color-coding on the map has been updated to better reflect CPI scores. Ukraine was incorrectly classified as an Autocratic Regime.


Investor Education
How MSCI Builds Thematic Indexes: A Step-by-Step Guide
From developing an index objective to choosing relevant stocks, this graphic breaks down how MSCI builds thematic indexes using examples.


How MSCI Builds Thematic Indexes: A Step-by-Step Guide
Have you ever wondered how MSCI builds its thematic indexes?
To capture long-term, structural trends that could drive business performance in the future, the company follows a systematic approach. This graphic from MSCI breaks down each step in the process used to create its thematic indexes.
Step 1: Develop an Index Objective
MSCI first builds a broad statement of what the theme aims to capture based on extensive research and insights from industry experts.
Steps 2 and 3: List Sub-Themes, Generate Keyword List
Together with experts, MSCI creates a list of sub-themes or “seedwords” to identify aligned business activities.
The team then assembles a collection of suitable documents describing the theme. Natural language processing efficiently analyzes word frequency and relevance to generate a more detailed set of keywords contextually similar to the seedwords.
Step 4: Find Relevant Companies
By analyzing financial reports, MSCI picks companies relevant to the theme using two methods:
- Direct approach: Revenue from a company’s business segment is considered 100% relevant if the segment name matches a theme keyword. Standard Industrial Classification (SIC) codes from these directly-matched segments make up the eligible SIC code list used in the indirect approach.
- Indirect approach: If a segment name doesn’t match theme keywords, MSCI will:
- Analyze the density of theme keywords mentioned in the company’s description. A minimum of two unique keywords is required.
- The keyword density determines a “discount factor” to reflect lower certainty in theme alignment.
- Revenue from business segments with an eligible SIC code, regardless of how they are named, is scaled down by the discount factor.
The total percentage of revenue applicable to the theme from both approaches determines a company’s relevance score.
Step 5: Select the Stocks
Finally, MSCI narrows down the stocks that will be included:
- Global parent universe: The ACWI Investable Market Index (IMI) is the starting point for standard thematic indexes.
- Relevance filter: The universe is filtered for companies with a relevance score of at least 25%.
- False positive control: Eligible companies that are mapped to un-related GICS sub-industries are removed.
Companies with higher relevance scores and market caps have a higher weighting in the index, with the maximum weighting for any one issuer capped at 5%. The final selected stocks span various sectors.
MSCI Thematic Indexes: Regularly Updated and Rules-Based
Once an index is built, it is reviewed semi-annually and updated based on:
- Changes to the parent index
- Changes at individual companies
- Theme developments based on expert input
Theme keywords are reviewed yearly in May. Overall, MSCI’s thematic index construction process is objective, scalable, and flexible. The process can be customized based on the theme(s) you want to capture.
Learn more about MSCI’s thematic indexes.

-

 Investor Education5 months ago
The 20 Most Common Investing Mistakes, in One Chart
Here are the most common investing mistakes to avoid, from emotionally-driven investing to paying too much in fees.
-

 Stocks10 months ago
Visualizing BlackRock’s Top Equity Holdings
BlackRock is the world’s largest asset manager, with over $9 trillion in holdings. Here are the company’s top equity holdings.
-

 Investor Education10 months ago
10-Year Annualized Forecasts for Major Asset Classes
This infographic visualizes 10-year annualized forecasts for both equities and fixed income using data from Vanguard.
-

 Investor Education1 year ago
Visualizing 90 Years of Stock and Bond Portfolio Performance
How have investment returns for different portfolio allocations of stocks and bonds compared over the last 90 years?
-

 Debt2 years ago
Countries with the Highest Default Risk in 2022
In this infographic, we examine new data that ranks the top 25 countries by their default risk.
-

 Markets2 years ago
The Best Months for Stock Market Gains
This infographic analyzes over 30 years of stock market performance to identify the best and worst months for gains.


-
 Money2 weeks ago
Visualizing the Growth of $100, by Asset Class (1970-2023)
-

 Money1 week ago
Where Does One U.S. Tax Dollar Go?
-

 Green2 weeks ago
Ranked: Top Countries by Total Forest Loss Since 2001
-

 Real Estate2 weeks ago
Visualizing America’s Shortage of Affordable Homes
-

 Maps2 weeks ago
Mapped: Average Wages Across Europe
-

 Mining2 weeks ago
Charted: The Value Gap Between the Gold Price and Gold Miners
-

 Demographics2 weeks ago
Visualizing the Size of the Global Senior Population
-

 Automotive2 weeks ago
Tesla Is Once Again the World’s Best-Selling EV Company