The Top 391 Fastest and Slowest UK Local Areas by Broadband Speed
Consumer magazine Which? has used data from its broadband ISP speedtest to both identify some of the UK’s fastest local authority areas for average download speed (Broxbourne on 32.5Mbps) and some of its slowest “black spots” (Orkney islands on 3Mbps) for 2019. But network availability may tell a different story.
The 2019 study is said to be based on data from 277,575 consumer speedtests (the speeds presented are median values), which were conducted via Which?’s own broadband speed checker in the year to 30th September 2018. However it’s unclear whether the magazine has included or excluded mobile data (3G / 4G) and enterprise (business) lines from their study.
Overall the study found that the top slowest local authority areas were the Scottish Orkney Islands (3Mbps), Allerdale (5.7Mbps) and the Shetland Islands (6.7Mbps). Meanwhile the fastest areas were named as Broxbourne (32.5Mbps), Crawley (32.3Mbps) and Newark & Sherwood (30Mbps).
In response Which? says that consumers “face a lottery when it comes to broadband connectivity” and that “residents in 15 UK local authority” are “failing to access” a minimum speed of 10Mbps, which is the starting point for the Government’s forthcoming new Universal Service Obligation (USO) that is due to be begin later this year.
Alex Neill, Which? MD of Home Products and Services, said:
“Having a good broadband connection is a basic requirement for many important everyday tasks, so it is unacceptable that millions of people around the country are still struggling to get what they need.
The Government and the regulator must now press ahead with plans to provide a bare minimum connection speed of 10 Megabits in every household and make sure that no one is at a disadvantage because of where they live.”
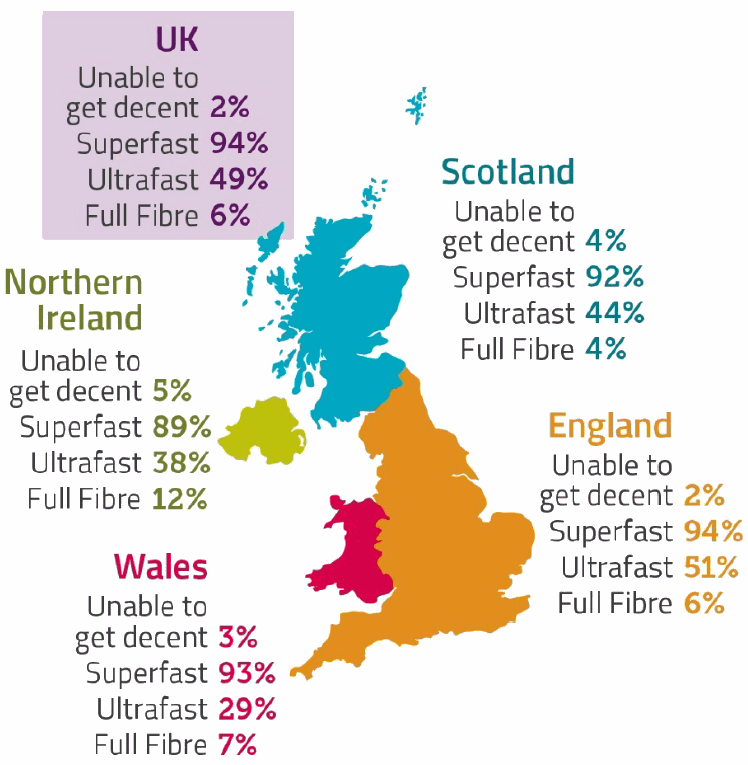
Happily Which? have correctly noted that the main problem is with how “many people were still not taking up the fastest service available in their area.” Ofcom’s latest Connected Nations 2018 report found that take-up of 30Mbps+ “superfast broadband” services stood at 45% (up from 38% in 2017 and 31% in 2016), but this is below the current national availability of such networks.
At present the Government’s £1.6bn (public funding commitment) Broadband Delivery UK project has already helped to extend “superfast” broadband to more than 95% of UK premises and this could reach 98% by the end of 2020. We should point out that this is a national average and the figure will vary by area. Meanwhile the 10Mbps USO is intended to help the final c.2% of largely remote rural premises.
Clearly a lot of areas have a high availability of so-called “superfast broadband” and thus you might well expect their overall results to be better, but then not everybody chooses to upgrade. Indeed it usually takes several years of natural migration before the majority in any given area have adopted the new services.
A number of factors can impact take-up in this way, such as the higher prices for related “fibre” services, as well as customers being locked into long contracts with their existing ISP (can’t upgrade yet) and a lack of general awareness (locals don’t always know that the faster service exists) or interest in the new connectivity (if you have a decent ADSL2+ speed and only basic needs then you might feel less inclined to upgrade).
The fear of switching to a different ISP may also obstruct some services. In other cases the new service may run out of capacity (i.e. demand is higher than expected), which means that people who want to upgrade are prevented from doing so until Openreach resolves the problem, although the scale of this issue is fairly small.
On top of that the speedtest themselves don’t tell the whole story, not least because they can be agressively affected by other factors like slow WiFi, local network congestion, local traffic management systems and software / configuration errors. In short, studies like this don’t accurately reflect the availability of faster networks. Take with a pinch of salt.
Andrew Glover, Chair of the ISP Association (ISPA), said:
“ISPs have made significant progress in boosting broadband speeds in recent years, as Ofcom’s official figures show that across the UK, average download speeds have increased by 28% over the past year to 46.2Mbps.
The data used by Which? appears to be gathered from customer speed tests and therefore may not be fully representative of speeds available. Ofcom’s Boost Your Broadband campaign can show where faster connections are already available should customers want them, including some of the areas mentioned in the report.
Whilst some of this progress is highlighted by Which?, the report does indicate that there is still work to be done to ensure that no area in the UK is left behind. ISPA’s members are working hard to deliver quality broadband services to consumers across the UK, and are committed to rolling out the next generation of broadband infrastructure and services to those that need it. There are also a wide variety of new ISPs breaking into the industry to deliver new and innovative solutions.
For those in true ‘not-spots’ the Broadband USO is due to be implemented by Ofcom in 2019, which will give everyone the legal right to request a 10Mbps connection.”
We’ve published the full results below and ordered the table by median (average) speed, starting from the fastest and going to the slowest at the bottom. For those who don’t know, the median is the middle point of a number set, in which half the numbers are above the median and half are below.
| Local Authority | Urban/Rural (Wales and NI) | Median Download (Mbps) | Number of Records |
| Broxbourne | Urban (Eng & Scot) | 32.5 | 283 |
| Crawley | Urban (Eng & Scot) | 32.3 | 318 |
| Newark and Sherwood | Rural (Eng & Scot) | 30 | 890 |
| West Dunbartonshire | Urban (Eng & Scot) | 29.6 | 271 |
| Watford | Urban (Eng & Scot) | 29.5 | 311 |
| Rushmoor | Urban (Eng & Scot) | 28.9 | 282 |
| Nottingham | Urban (Eng & Scot) | 27.6 | 703 |
| Cambridge | Urban (Eng & Scot) | 27.3 | 454 |
| Nuneaton and Bedworth | Urban (Eng & Scot) | 27.2 | 374 |
| Inverclyde | Urban (Eng & Scot) | 26.9 | 295 |
| Redditch | Urban (Eng & Scot) | 26.6 | 363 |
| North East Lincolnshire | Urban (Eng & Scot) | 26.4 | 447 |
| Harrow | Urban (Eng & Scot) | 26 | 747 |
| Barking and Dagenham | Urban (Eng & Scot) | 25.7 | 338 |
| Luton | Urban (Eng & Scot) | 25.6 | 415 |
| Ashfield | Urban (Eng & Scot) | 25.5 | 461 |
| Lincoln | Urban (Eng & Scot) | 25.2 | 303 |
| Slough | Urban (Eng & Scot) | 25.2 | 294 |
| Gloucester | Urban (Eng & Scot) | 25 | 391 |
| Ipswich | Urban (Eng & Scot) | 25 | 410 |
| Torbay | Urban (Eng & Scot) | 24.7 | 983 |
| Hartlepool | Urban (Eng & Scot) | 24.4 | 244 |
| Middlesbrough | Urban (Eng & Scot) | 24.4 | 293 |
| Elmbridge | Urban (Eng & Scot) | 24.2 | 698 |
| Blackpool | Urban (Eng & Scot) | 24.1 | 599 |
| Derby | Urban (Eng & Scot) | 24.1 | 666 |
| Gosport | Urban (Eng & Scot) | 24.1 | 318 |
| Sutton | Urban (Eng & Scot) | 24.1 | 687 |
| Cardiff | Northern Ireland & Wales | 24 | 1,199 |
| Dudley | Urban (Eng & Scot) | 23.9 | 873 |
| Greenwich | Urban (Eng & Scot) | 23.6 | 760 |
| Surrey Heath | Urban (Eng & Scot) | 23.5 | 440 |
| Wellingborough | Urban (Eng & Scot) | 23.4 | 312 |
| Leicester | Urban (Eng & Scot) | 23.2 | 687 |
| Portsmouth | Urban (Eng & Scot) | 23.2 | 634 |
| Redcar and Cleveland | Urban (Eng & Scot) | 23.2 | 492 |
| Woking | Urban (Eng & Scot) | 23.2 | 499 |
| Dundee City | Urban (Eng & Scot) | 23.1 | 453 |
| Harlow | Urban (Eng & Scot) | 23.1 | 242 |
| Kingston upon Thames | Urban (Eng & Scot) | 23.1 | 658 |
| Plymouth | Urban (Eng & Scot) | 23.1 | 952 |
| Bracknell Forest | Urban (Eng & Scot) | 23 | 508 |
| Darlington | Urban (Eng & Scot) | 22.9 | 422 |
| Erewash | Urban (Eng & Scot) | 22.9 | 370 |
| Halton | Urban (Eng & Scot) | 22.8 | 484 |
| Eastbourne | Urban (Eng & Scot) | 22.7 | 572 |
| Merton | Urban (Eng & Scot) | 22.7 | 681 |
| Three Rivers | Urban (Eng & Scot) | 22.7 | 414 |
| Enfield | Urban (Eng & Scot) | 22.6 | 737 |
| Solihull | Urban (Eng & Scot) | 22.6 | 842 |
| Gedling | Urban (Eng & Scot) | 22.5 | 437 |
| Telford and Wrekin | Urban (Eng & Scot) | 22.5 | 588 |
| Havering | Urban (Eng & Scot) | 22.4 | 713 |
| Hillingdon | Urban (Eng & Scot) | 22.4 | 758 |
| Fareham | Urban (Eng & Scot) | 22.3 | 600 |
| Belfast | Northern Ireland & Wales | 22.2 | 742 |
| Blaby | Urban (Eng & Scot) | 22.2 | 436 |
| Havant | Urban (Eng & Scot) | 22.2 | 545 |
| Spelthorne | Urban (Eng & Scot) | 22.2 | 396 |
| Hounslow | Urban (Eng & Scot) | 22 | 696 |
| Kettering | Urban (Eng & Scot) | 22 | 383 |
| Lichfield | Urban (Eng & Scot) | 22 | 424 |
| North Lanarkshire | Urban (Eng & Scot) | 22 | 1,018 |
| Brighton and Hove | Urban (Eng & Scot) | 21.8 | 1,208 |
| Oadby and Wigston | Urban (Eng & Scot) | 21.8 | 193 |
| Oxford | Urban (Eng & Scot) | 21.8 | 436 |
| South Staffordshire | Urban (Eng & Scot) | 21.8 | 730 |
| Huntingdonshire | Rural (Eng & Scot) | 21.7 | 982 |
| Mansfield | Urban (Eng & Scot) | 21.7 | 340 |
| Stockport | Urban (Eng & Scot) | 21.7 | 1,102 |
| Derry City and Strabane | Northern Ireland & Wales | 21.4 | 434 |
| East Renfrewshire | Urban (Eng & Scot) | 21.4 | 522 |
| Hertsmere | Urban (Eng & Scot) | 21.4 | 371 |
| Tamworth | Urban (Eng & Scot) | 21.4 | 240 |
| Guildford | Urban (Eng & Scot) | 21.3 | 656 |
| Broxtowe | Urban (Eng & Scot) | 21.2 | 439 |
| East Dunbartonshire | Urban (Eng & Scot) | 21.2 | 551 |
| North West Leicestershire | Rural (Eng & Scot) | 21.2 | 473 |
| Adur | Urban (Eng & Scot) | 21.1 | 305 |
| Bolton | Urban (Eng & Scot) | 21.1 | 964 |
| Bournemouth | Urban (Eng & Scot) | 21.1 | 851 |
| Bradford | Urban (Eng & Scot) | 21.1 | 1,563 |
| Richmond upon Thames | Urban (Eng & Scot) | 21.1 | 932 |
| Poole | Urban (Eng & Scot) | 21 | 714 |
| Trafford | Urban (Eng & Scot) | 21 | 792 |
| Norwich | Urban (Eng & Scot) | 20.9 | 453 |
| Bromley | Urban (Eng & Scot) | 20.8 | 1,383 |
| Northampton | Urban (Eng & Scot) | 20.8 | 732 |
| Peterborough | Urban (Eng & Scot) | 20.7 | 598 |
| Warrington | Urban (Eng & Scot) | 20.7 | 935 |
| Medway | Urban (Eng & Scot) | 20.6 | 902 |
| Reigate and Banstead | Urban (Eng & Scot) | 20.6 | 801 |
| South Northamptonshire | Rural (Eng & Scot) | 20.6 | 498 |
| St Albans | Urban (Eng & Scot) | 20.6 | 811 |
| Stoke-on-Trent | Urban (Eng & Scot) | 20.6 | 730 |
| Bristol, City of | Urban (Eng & Scot) | 20.5 | 1,650 |
| Thurrock | Urban (Eng & Scot) | 20.5 | 397 |
| Charnwood | Urban (Eng & Scot) | 20.4 | 678 |
| Corby | Urban (Eng & Scot) | 20.4 | 227 |
| Liverpool | Urban (Eng & Scot) | 20.4 | 1,258 |
| Oldham | Urban (Eng & Scot) | 20.2 | 692 |
| Birmingham | Urban (Eng & Scot) | 20 | 2,493 |
| Falkirk | Urban (Eng & Scot) | 19.9 | 546 |
| Welwyn Hatfield | Urban (Eng & Scot) | 19.9 | 557 |
| Rossendale | Urban (Eng & Scot) | 19.8 | 339 |
| Warwick | Urban (Eng & Scot) | 19.8 | 626 |
| Wigan | Urban (Eng & Scot) | 19.8 | 969 |
| Worthing | Urban (Eng & Scot) | 19.7 | 436 |
| Newport | Northern Ireland & Wales | 19.6 | 573 |
| Eastleigh | Urban (Eng & Scot) | 19.5 | 671 |
| Newcastle-under-Lyme | Urban (Eng & Scot) | 19.5 | 450 |
| Preston | Urban (Eng & Scot) | 19.5 | 443 |
| Stockton-on-Tees | Urban (Eng & Scot) | 19.5 | 702 |
| Newcastle upon Tyne | Urban (Eng & Scot) | 19.4 | 872 |
| Brent | Urban (Eng & Scot) | 19.2 | 773 |
| Hyndburn | Urban (Eng & Scot) | 19.2 | 276 |
| Rushcliffe | Rural (Eng & Scot) | 19.2 | 715 |
| Stevenage | Urban (Eng & Scot) | 19.2 | 528 |
| West Oxfordshire | Rural (Eng & Scot) | 19.2 | 572 |
| Wolverhampton | Urban (Eng & Scot) | 19.2 | 607 |
| Knowsley | Urban (Eng & Scot) | 19.1 | 461 |
| Manchester | Urban (Eng & Scot) | 19 | 1,403 |
| Southend-on-Sea | Urban (Eng & Scot) | 19 | 593 |
| Ealing | Urban (Eng & Scot) | 18.9 | 1,106 |
| Hart | Urban (Eng & Scot) | 18.9 | 641 |
| Vale of White Horse | Rural (Eng & Scot) | 18.7 | 661 |
| Blackburn with Darwen | Urban (Eng & Scot) | 18.6 | 443 |
| Bury | Urban (Eng & Scot) | 18.6 | 774 |
| Sandwell | Urban (Eng & Scot) | 18.5 | 688 |
| Haringey | Urban (Eng & Scot) | 18.4 | 695 |
| Cherwell | Urban (Eng & Scot) | 18.3 | 698 |
| Sefton | Urban (Eng & Scot) | 18.3 | 1,041 |
| Croydon | Urban (Eng & Scot) | 18.2 | 1,206 |
| Milton Keynes | Urban (Eng & Scot) | 18.2 | 1,122 |
| Neath Port Talbot | Northern Ireland & Wales | 18.2 | 565 |
| Worcester | Urban (Eng & Scot) | 18.2 | 391 |
| Christchurch | Urban (Eng & Scot) | 18.1 | 245 |
| Harborough | Rural (Eng & Scot) | 18.1 | 458 |
| Rutland | Rural (Eng & Scot) | 18.1 | 267 |
| Leeds | Urban (Eng & Scot) | 18 | 2,570 |
| Salford | Urban (Eng & Scot) | 18 | 686 |
| Blaenau Gwent | Northern Ireland & Wales | 17.9 | 312 |
| East Lothian | Urban (Eng & Scot) | 17.9 | 705 |
| Lisburn and Castlereagh | Northern Ireland & Wales | 17.9 | 523 |
| South Cambridgeshire | Rural (Eng & Scot) | 17.9 | 778 |
| East Northamptonshire | Rural (Eng & Scot) | 17.7 | 415 |
| Wokingham | Urban (Eng & Scot) | 17.7 | 989 |
| Epsom and Ewell | Urban (Eng & Scot) | 17.6 | 364 |
| South Tyneside | Urban (Eng & Scot) | 17.6 | 548 |
| Torfaen | Northern Ireland & Wales | 17.6 | 426 |
| Caerphilly | Northern Ireland & Wales | 17.5 | 756 |
| Cheltenham | Urban (Eng & Scot) | 17.4 | 594 |
| Dartford | Urban (Eng & Scot) | 17.4 | 331 |
| South Kesteven | Rural (Eng & Scot) | 17.4 | 718 |
| Hinckley and Bosworth | Rural (Eng & Scot) | 17.3 | 480 |
| Lancaster | Urban (Eng & Scot) | 17.3 | 582 |
| Ards and North Down | Northern Ireland & Wales | 17.2 | 681 |
| Cannock Chase | Urban (Eng & Scot) | 17.2 | 359 |
| Fenland | Rural (Eng & Scot) | 17.2 | 499 |
| Rugby | Urban (Eng & Scot) | 17.2 | 479 |
| South Gloucestershire | Urban (Eng & Scot) | 17.2 | 1,379 |
| Barnet | Urban (Eng & Scot) | 17.1 | 1,228 |
| City of Edinburgh | Urban (Eng & Scot) | 17.1 | 2,127 |
| East Cambridgeshire | Rural (Eng & Scot) | 17.1 | 404 |
| North Tyneside | Urban (Eng & Scot) | 17.1 | 876 |
| Reading | Urban (Eng & Scot) | 17.1 | 554 |
| Rochdale | Urban (Eng & Scot) | 17.1 | 672 |
| South Ribble | Urban (Eng & Scot) | 17.1 | 463 |
| Castle Point | Urban (Eng & Scot) | 17 | 340 |
| Redbridge | Urban (Eng & Scot) | 17 | 805 |
| Swansea | Northern Ireland & Wales | 17 | 886 |
| Waltham Forest | Urban (Eng & Scot) | 17 | 681 |
| Wirral | Urban (Eng & Scot) | 16.9 | 1,492 |
| Aylesbury Vale | Rural (Eng & Scot) | 16.8 | 960 |
| Craven | Rural (Eng & Scot) | 16.8 | 350 |
| Epping Forest | Urban (Eng & Scot) | 16.8 | 438 |
| Forest Heath | Rural (Eng & Scot) | 16.8 | 242 |
| Mid Devon | Rural (Eng & Scot) | 16.8 | 876 |
| Walsall | Urban (Eng & Scot) | 16.8 | 730 |
| Bedford | Urban (Eng & Scot) | 16.7 | 792 |
| Melton | Rural (Eng & Scot) | 16.7 | 273 |
| Rhondda Cynon Taf | Northern Ireland & Wales | 16.7 | 979 |
| Sunderland | Urban (Eng & Scot) | 16.7 | 897 |
| Basildon | Urban (Eng & Scot) | 16.6 | 632 |
| Camden | Urban (Eng & Scot) | 16.6 | 663 |
| Exeter | Urban (Eng & Scot) | 16.6 | 533 |
| Fylde | Urban (Eng & Scot) | 16.6 | 517 |
| Lewisham | Urban (Eng & Scot) | 16.6 | 823 |
| Mid Sussex | Urban (Eng & Scot) | 16.6 | 866 |
| Carlisle | Urban (Eng & Scot) | 16.5 | 628 |
| Central Bedfordshire | Rural (Eng & Scot) | 16.5 | 1,379 |
| Merthyr Tydfil | Northern Ireland & Wales | 16.4 | 240 |
| Coventry | Urban (Eng & Scot) | 16.3 | 990 |
| Dacorum | Urban (Eng & Scot) | 16.3 | 759 |
| Folkestone and Hythe | Urban (Eng & Scot) | 16.3 | 473 |
| North Hertfordshire | Urban (Eng & Scot) | 16.3 | 716 |
| Glasgow City | Urban (Eng & Scot) | 16.2 | 1,853 |
| South Lanarkshire | Urban (Eng & Scot) | 16.2 | 1,361 |
| Tameside | Urban (Eng & Scot) | 16.2 | 827 |
| West Lothian | Urban (Eng & Scot) | 16.2 | 807 |
| Hackney | Urban (Eng & Scot) | 16.1 | 677 |
| Harrogate | Urban (Eng & Scot) | 16.1 | 815 |
| Windsor and Maidenhead | Urban (Eng & Scot) | 16.1 | 732 |
| Bolsover | Urban (Eng & Scot) | 16 | 309 |
| Newham | Urban (Eng & Scot) | 16 | 517 |
| Stafford | Urban (Eng & Scot) | 16 | 676 |
| York | Urban (Eng & Scot) | 16 | 1,053 |
| Barrow-in-Furness | Urban (Eng & Scot) | 15.9 | 273 |
| North Warwickshire | Rural (Eng & Scot) | 15.9 | 257 |
| Renfrewshire | Urban (Eng & Scot) | 15.9 | 762 |
| St Edmundsbury | Rural (Eng & Scot) | 15.9 | 693 |
| Wakefield | Urban (Eng & Scot) | 15.9 | 1,218 |
| Wychavon | Rural (Eng & Scot) | 15.9 | 789 |
| Arun | Urban (Eng & Scot) | 15.8 | 962 |
| Bexley | Urban (Eng & Scot) | 15.8 | 701 |
| East Riding of Yorkshire | Rural (Eng & Scot) | 15.8 | 1,380 |
| Mole Valley | Urban (Eng & Scot) | 15.8 | 472 |
| Southampton | Urban (Eng & Scot) | 15.7 | 1,092 |
| Thanet | Urban (Eng & Scot) | 15.7 | 684 |
| Great Yarmouth | Urban (Eng & Scot) | 15.6 | 364 |
| Hastings | Urban (Eng & Scot) | 15.6 | 452 |
| South Ayrshire | Urban (Eng & Scot) | 15.6 | 600 |
| Bath and North East Somerset | Urban (Eng & Scot) | 15.5 | 901 |
| Colchester | Urban (Eng & Scot) | 15.5 | 846 |
| West Lindsey | Rural (Eng & Scot) | 15.5 | 455 |
| Bassetlaw | Rural (Eng & Scot) | 15.4 | 609 |
| Chesterfield | Urban (Eng & Scot) | 15.4 | 430 |
| Fife | Urban (Eng & Scot) | 15.4 | 1,855 |
| High Peak | Rural (Eng & Scot) | 15.4 | 502 |
| Ryedale | Rural (Eng & Scot) | 15.4 | 333 |
| Wiltshire | Rural (Eng & Scot) | 15.4 | 2,875 |
| Amber Valley | Urban (Eng & Scot) | 15.3 | 710 |
| Lewes | Urban (Eng & Scot) | 15.3 | 670 |
| Pendle | Urban (Eng & Scot) | 15.3 | 300 |
| Scarborough | Urban (Eng & Scot) | 15.3 | 568 |
| Tandridge | Urban (Eng & Scot) | 15.3 | 587 |
| Wandsworth | Urban (Eng & Scot) | 15.3 | 1,158 |
| Cheshire East | Urban (Eng & Scot) | 15.2 | 2,043 |
| County Durham | Rural (Eng & Scot) | 15.2 | 2,296 |
| Midlothian | Urban (Eng & Scot) | 15.2 | 477 |
| North Kesteven | Rural (Eng & Scot) | 15.2 | 539 |
| Rotherham | Urban (Eng & Scot) | 15.2 | 867 |
| Armagh City, Banbridge and Craigavon | Northern Ireland & Wales | 15.1 | 674 |
| Barnsley | Urban (Eng & Scot) | 15.1 | 1,080 |
| Burnley | Urban (Eng & Scot) | 15.1 | 290 |
| Cheshire West and Chester | Urban (Eng & Scot) | 15.1 | 1,849 |
| Kensington and Chelsea | Urban (Eng & Scot) | 15.1 | 429 |
| Clackmannanshire | Urban (Eng & Scot) | 15 | 266 |
| Daventry | Rural (Eng & Scot) | 15 | 559 |
| Kingston upon Hull, City of | Urban (Eng & Scot) | 15 | 387 |
| Kirklees | Urban (Eng & Scot) | 15 | 1,585 |
| North Lincolnshire | Urban (Eng & Scot) | 15 | 717 |
| Swindon | Urban (Eng & Scot) | 15 | 789 |
| Basingstoke and Deane | Urban (Eng & Scot) | 14.9 | 971 |
| Sheffield | Urban (Eng & Scot) | 14.9 | 1,887 |
| South Oxfordshire | Rural (Eng & Scot) | 14.9 | 862 |
| Vale of Glamorgan | Northern Ireland & Wales | 14.9 | 633 |
| Waveney | Urban (Eng & Scot) | 14.9 | 585 |
| Hammersmith and Fulham | Urban (Eng & Scot) | 14.8 | 662 |
| South Somerset | Rural (Eng & Scot) | 14.8 | 1,164 |
| Stratford-on-Avon | Rural (Eng & Scot) | 14.8 | 879 |
| Antrim and Newtownabbey | Northern Ireland & Wales | 14.7 | 504 |
| Causeway Coast and Glens | Northern Ireland & Wales | 14.7 | 510 |
| Doncaster | Urban (Eng & Scot) | 14.7 | 1,114 |
| Flintshire | Northern Ireland & Wales | 14.7 | 772 |
| Isle of Anglesey | Northern Ireland & Wales | 14.7 | 419 |
| Maidstone | Urban (Eng & Scot) | 14.7 | 773 |
| Broadland | Urban (Eng & Scot) | 14.6 | 707 |
| East Ayrshire | Urban (Eng & Scot) | 14.6 | 526 |
| Horsham | Rural (Eng & Scot) | 14.6 | 906 |
| Rochford | Urban (Eng & Scot) | 14.6 | 421 |
| Isle of Wight | Rural (Eng & Scot) | 14.5 | 832 |
| St. Helens | Urban (Eng & Scot) | 14.5 | 707 |
| Hambleton | Rural (Eng & Scot) | 14.4 | 497 |
| Runnymede | Urban (Eng & Scot) | 14.4 | 406 |
| Chelmsford | Urban (Eng & Scot) | 14.3 | 890 |
| Dover | Urban (Eng & Scot) | 14.3 | 539 |
| Islington | Urban (Eng & Scot) | 14.2 | 707 |
| Sedgemoor | Rural (Eng & Scot) | 14.2 | 718 |
| Chorley | Urban (Eng & Scot) | 14.1 | 472 |
| Northumberland | Rural (Eng & Scot) | 14.1 | 1,856 |
| Wyre | Rural (Eng & Scot) | 14.1 | 567 |
| East Hertfordshire | Urban (Eng & Scot) | 14 | 883 |
| West Somerset | Rural (Eng & Scot) | 14 | 232 |
| Braintree | Rural (Eng & Scot) | 13.9 | 795 |
| East Dorset | Urban (Eng & Scot) | 13.8 | 791 |
| Gateshead | Urban (Eng & Scot) | 13.8 | 616 |
| North Dorset | Rural (Eng & Scot) | 13.8 | 472 |
| Tonbridge and Malling | Urban (Eng & Scot) | 13.8 | 601 |
| West Dorset | Rural (Eng & Scot) | 13.8 | 757 |
| North Somerset | Urban (Eng & Scot) | 13.7 | 1,380 |
| Richmondshire | Rural (Eng & Scot) | 13.7 | 291 |
| South Derbyshire | Urban (Eng & Scot) | 13.7 | 472 |
| Wyre Forest | Urban (Eng & Scot) | 13.7 | 414 |
| King’s Lynn and West Norfolk | Rural (Eng & Scot) | 13.6 | 851 |
| Wealden | Rural (Eng & Scot) | 13.6 | 1,148 |
| Aberdeen City | Urban (Eng & Scot) | 13.5 | 1,102 |
| Chiltern | Urban (Eng & Scot) | 13.5 | 744 |
| Brentwood | Urban (Eng & Scot) | 13.4 | 394 |
| Tendring | Rural (Eng & Scot) | 13.4 | 753 |
| West Berkshire | Urban (Eng & Scot) | 13.4 | 854 |
| Boston | Urban (Eng & Scot) | 13.3 | 274 |
| East Hampshire | Rural (Eng & Scot) | 13.3 | 949 |
| Gravesham | Urban (Eng & Scot) | 13.3 | 352 |
| Mid and East Antrim | Northern Ireland & Wales | 13.3 | 556 |
| Waverley | Rural (Eng & Scot) | 13.3 | 905 |
| North Ayrshire | Urban (Eng & Scot) | 13.2 | 708 |
| Ribble Valley | Rural (Eng & Scot) | 13.2 | 287 |
| Rother | Rural (Eng & Scot) | 13.2 | 618 |
| Swale | Rural (Eng & Scot) | 13.2 | 653 |
| Conwy | Northern Ireland & Wales | 13.1 | 707 |
| Cotswold | Rural (Eng & Scot) | 13.1 | 565 |
| Lambeth | Urban (Eng & Scot) | 13.1 | 983 |
| Sevenoaks | Rural (Eng & Scot) | 13.1 | 691 |
| West Lancashire | Urban (Eng & Scot) | 13.1 | 591 |
| Bridgend | Northern Ireland & Wales | 13 | 638 |
| Chichester | Rural (Eng & Scot) | 13 | 815 |
| East Staffordshire | Urban (Eng & Scot) | 13 | 517 |
| Staffordshire Moorlands | Rural (Eng & Scot) | 13 | 386 |
| Eden | Rural (Eng & Scot) | 12.9 | 348 |
| Purbeck | Rural (Eng & Scot) | 12.9 | 328 |
| South Lakeland | Rural (Eng & Scot) | 12.9 | 674 |
| Stirling | Urban (Eng & Scot) | 12.8 | 537 |
| North Devon | Rural (Eng & Scot) | 12.7 | 542 |
| South Bucks | Urban (Eng & Scot) | 12.7 | 370 |
| Test Valley | Urban (Eng & Scot) | 12.7 | 767 |
| Weymouth and Portland | Urban (Eng & Scot) | 12.7 | 390 |
| Bromsgrove | Urban (Eng & Scot) | 12.6 | 457 |
| Denbighshire | Northern Ireland & Wales | 12.5 | 571 |
| Pembrokeshire | Northern Ireland & Wales | 12.5 | 829 |
| Wrexham | Northern Ireland & Wales | 12.5 | 621 |
| Wycombe | Urban (Eng & Scot) | 12.4 | 1,056 |
| Babergh | Rural (Eng & Scot) | 12.3 | 606 |
| Derbyshire Dales | Rural (Eng & Scot) | 12.3 | 516 |
| South Holland | Rural (Eng & Scot) | 12.3 | 436 |
| South Norfolk | Rural (Eng & Scot) | 12.3 | 947 |
| East Lindsey | Rural (Eng & Scot) | 12.2 | 811 |
| Southwark | Urban (Eng & Scot) | 12.2 | 943 |
| Calderdale | Urban (Eng & Scot) | 12.1 | 915 |
| Ashford | Urban (Eng & Scot) | 12 | 594 |
| Cornwall | Rural (Eng & Scot) | 12 | 3,425 |
| Mendip | Rural (Eng & Scot) | 12 | 691 |
| New Forest | Urban (Eng & Scot) | 12 | 1,302 |
| Winchester | Rural (Eng & Scot) | 12 | 844 |
| Taunton Deane | Urban (Eng & Scot) | 11.9 | 847 |
| Angus | Urban (Eng & Scot) | 11.8 | 675 |
| Dumfries and Galloway | Rural (Eng & Scot) | 11.8 | 965 |
| Newry, Mourne and Down | Northern Ireland & Wales | 11.8 | 543 |
| Uttlesford | Rural (Eng & Scot) | 11.6 | 563 |
| Canterbury | Urban (Eng & Scot) | 11.5 | 905 |
| Na h-Eileanan Siar | Rural (Eng & Scot) | 11.5 | 161 |
| North East Derbyshire | Urban (Eng & Scot) | 11.5 | 491 |
| North Norfolk | Rural (Eng & Scot) | 11.5 | 680 |
| Copeland | Rural (Eng & Scot) | 11.4 | 400 |
| East Devon | Rural (Eng & Scot) | 11.4 | 1,118 |
| Stroud | Urban (Eng & Scot) | 11.4 | 812 |
| Tewkesbury | Rural (Eng & Scot) | 11.4 | 439 |
| Tunbridge Wells | Urban (Eng & Scot) | 11.4 | 616 |
| Teignbridge | Rural (Eng & Scot) | 11.3 | 1,000 |
| Breckland | Rural (Eng & Scot) | 11.1 | 837 |
| Maldon | Rural (Eng & Scot) | 11.1 | 458 |
| Westminster | Urban (Eng & Scot) | 10.8 | 683 |
| Forest of Dean | Rural (Eng & Scot) | 10.6 | 579 |
| Gwynedd | Northern Ireland & Wales | 10.6 | 632 |
| Selby | Rural (Eng & Scot) | 10.5 | 529 |
| Shropshire | Rural (Eng & Scot) | 10.5 | 1,840 |
| Suffolk Coastal | Rural (Eng & Scot) | 10.4 | 822 |
| Torridge | Rural (Eng & Scot) | 10.3 | 525 |
| Aberdeenshire | Rural (Eng & Scot) | 10.1 | 1,749 |
| Carmarthenshire | Northern Ireland & Wales | 10.1 | 1,361 |
| Malvern Hills | Rural (Eng & Scot) | 10.1 | 607 |
| Perth and Kinross | Rural (Eng & Scot) | 10.1 | 1,040 |
| Tower Hamlets | Urban (Eng & Scot) | 10.1 | 670 |
| City of London | Urban (Eng & Scot) | 9.9 | 49 |
| South Hams | Rural (Eng & Scot) | 9.9 | 785 |
| West Devon | Rural (Eng & Scot) | 9.9 | 423 |
| Herefordshire, County of | Rural (Eng & Scot) | 9.7 | 1,062 |
| Mid Ulster | Northern Ireland & Wales | 9.5 | 360 |
| Monmouthshire | Northern Ireland & Wales | 9.5 | 678 |
| Scottish Borders | Rural (Eng & Scot) | 9.3 | 815 |
| Mid Suffolk | Rural (Eng & Scot) | 9.1 | 789 |
| Highland | Rural (Eng & Scot) | 8.9 | 1,672 |
| Powys | Northern Ireland & Wales | 7.7 | 900 |
| Ceredigion | Northern Ireland & Wales | 7.5 | 553 |
| Fermanagh and Omagh | Northern Ireland & Wales | 7.4 | 316 |
| Moray | Rural (Eng & Scot) | 7.1 | 691 |
| Argyll and Bute | Rural (Eng & Scot) | 7 | 756 |
| Shetland Islands | Rural (Eng & Scot) | 6.7 | 155 |
| Allerdale | Rural (Eng & Scot) | 5.7 | 641 |
| Orkney Islands | Rural (Eng & Scot) | 3 | 237 |
Mark is a professional technology writer, IT consultant and computer engineer from Dorset (England), he also founded ISPreview in 1999 and enjoys analysing the latest telecoms and broadband developments. Find me on X (Twitter), Mastodon, Facebook and Linkedin.


« Fibre Optic Builder Nextgenaccess Get New Chairman to Help UK Rollout
Latest UK ISP News


- FTTP (5511)
- BT (3514)
- Politics (2535)
- Openreach (2296)
- Business (2260)
- Building Digital UK (2243)
- FTTC (2042)
- Mobile Broadband (1972)
- Statistics (1788)
- 4G (1663)
- Virgin Media (1619)
- Ofcom Regulation (1460)
- Fibre Optic (1393)
- Wireless Internet (1389)
- FTTH (1381)


As always, statistics can be used and interpreted in any way you want. The number of people providing results in each area varies widely and you have no idea what the max and min or average speeds are which add to the story. There is no reference to which package a respondent has, so some areas could have more respondents on faster packages than other area. I presume the results include the impact of the home environment which will skew the data. And finally, the demographic of readers of Which! needs to be taken into account compared to other methods of gathering data.
What are Which! trying to achieve by publishing these results?
“What are Which! trying to achieve by publishing these results?!
I expect Which are trying to promote their brand, sell more subscriptions, and make more profit – just like most businesses. Improving broadband won’t be high on their list of priorities, it is just an issue that they know people will get worked up about that they can exploit.
surveys like this are so idiotic. guess which are justifying their existence. It is so poor that it makes you wonder if all their other surveys are rubbish too.
Agreed.
Which seems to have a problem producing anything sensible when it comes to broadband and are doing its subscribers a major disservice as a result. As you say, this does undermine the Which brand; the organisation would be well advised to outsource such activity to someone that knows what they’re talking about and can gather quality data like Andrew Ferguson.
Although I have criticised the lack of broadband knowledge of Which? in the past I have to congratulate them on using the much more realistic median average rather than the median used by Ofcom and other services.
Median average?
There’s median and there’s mean. Ofcom use median. Would you prefer they use mean?
If you would I’d hit the maths books again. Mean can be skewed by the two extremes as it’s the total of all the results in the sample divided by the number of participants, median is more representative as it is what the 50th percentile get.
typo – ofcom use mean unless they have changed it recently which as you say is unrealsistic but allows them to quote a higher number too seem to be more successful
We get under 2MBS and are about 1.8 mile away from 1 cabinet and same the other way how are they going to get our speed up to 10NBS when they have no plans to extend the fibre connection around 10 properties around me in the same position
Sat/4G if no other option.
You’ll get a quote, may need to contribute if the cost is excessive.
“face a lottery when it comes to broadband connectivity”
Hardly a lottery at all. If you move to the Orkney Islands from say, Watford, you’d be pretty stupid to expect the same speed.
““face a lottery when it comes to broadband connectivity”
Hardly a lottery at all. If you move to the Orkney Islands from say, Watford, you’d be pretty stupid to expect the same speed.”
Maybe not, at least if you listen to Which… Which (see what i did there) have some odd examples of what they feel is a rural and urban area. Quite how some areas which have more than one motorway leading into them and have telephone exchanges which serve 10’s of thousands are “RURAL” areas i guess they only know.